

See Table 2.5 showing financial statement data and stock price data for Mydeco Corp. Use the data
Question:
See Table 2.5 showing financial statement data and stock price data for Mydeco Corp. Use the data from the balance sheet and cash flow statement in 2019 to determine the following:
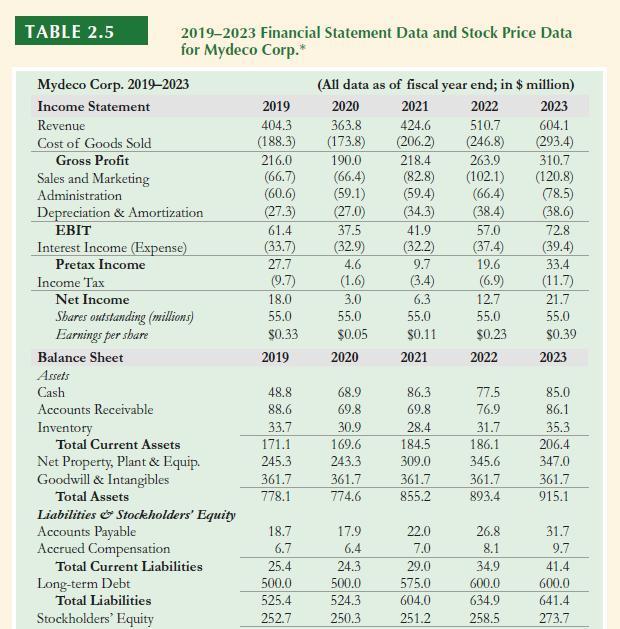
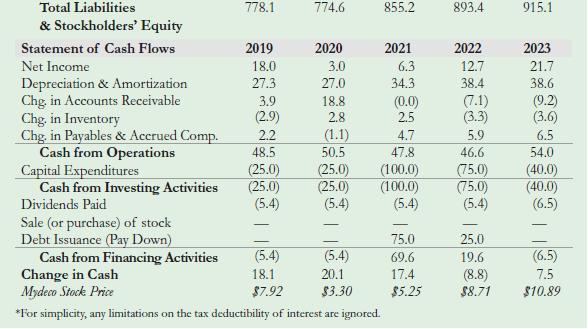
a. How much cash did Mydeco have at the end of 2018?
b. What were Mydeco’s accounts receivable and inventory at the end of 2018?
c. What were Mydeco’s total liabilities at the end of 2018?
d. Assuming goodwill and intangibles were equal in 2018 and 2019, what was Mydeco’s net property, plant, and equipment at the end of 2018?
Fantastic news! We've Found the answer you've been seeking!
Step by Step Answer:

Answered By
PRINCE PANDEY
I am Indian Chartered Accounting having a strong hold in the subjects of Accounting, IFRS Reporting, Indian
Taxation, Cost Accounting, Auditing. I have vast experience of teaching a student with easy way problem-solving approach.
1+ Reviews
10+ Question Solved
Related Book For 
Question Posted:
