

Graphical derivation of beta A fund manager wishes to estimate graphically the betas for two assets, X
Question:
Graphical derivation of beta A fund manager wishes to estimate graphically the betas for two assets, X and Y. It has gathered the return data shown in the following table for the market portfolio and for both assets over the past 10 years, 2010–2020.
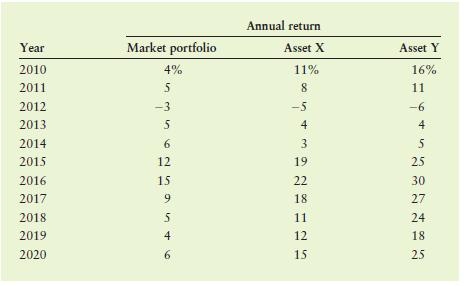
a. On a set of “market return (x-axis)–asset return (y-axis)” axes, plot the data given and draw the characteristic line for asset X and for asset Y.
b. Use the characteristic lines from part a to estimate the betas for assets X and Y.
c. Use the betas found in part b to comment on the relative risks of assets X and Y.
Step by Step Answer:

This question has not been answered yet.
You can Ask your question!
Related Book For 

Principles Of Managerial Finance
ISBN: 9781292400648
16th Global Edition
Authors: Chad Zutter, Scott Smart
Question Posted:
