

Using Tables 3.1, 3.2, and 3.3, conduct a complete ratio analysis of the Bartlett Company for the
Question:
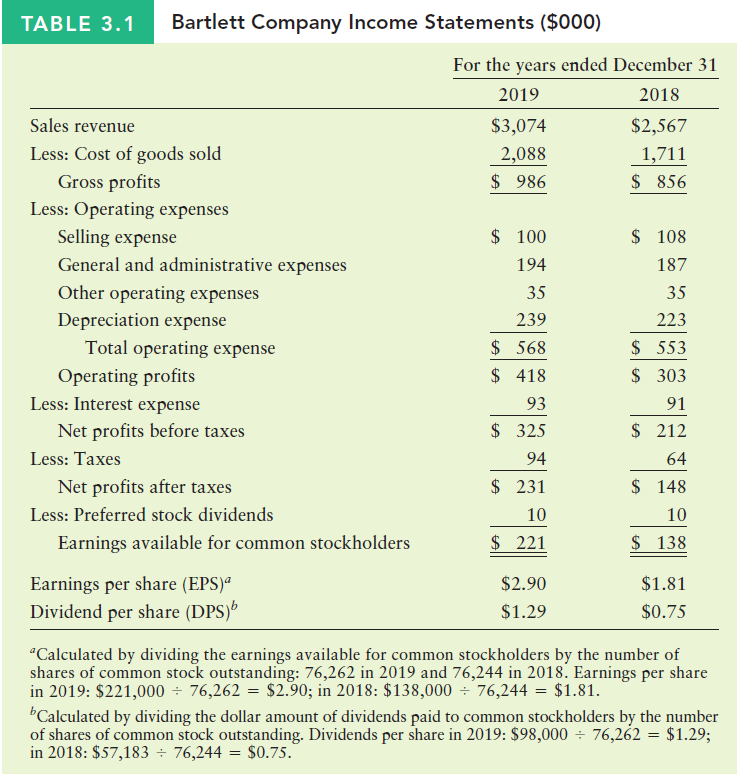
Using Tables 3.1, 3.2, and 3.3, conduct a complete ratio analysis of the Bartlett Company for the years 2018 and 2019. You should assess the firm’s liquidity, activity, debt, and profitability ratios. Highlight any particularly positive or negative developments that you uncover when comparing ratios from 2018 and 2019.
Fantastic news! We've Found the answer you've been seeking!
Step by Step Answer:
From 2018 to 2019 Bartletts liquidity position weakened in that the current ratio deteriorated and a...View the full answer

Answered By
ANDREW KIPRUTO
Academic Writing Expert
I have over 7 years of research and application experience. I am trained and licensed to provide expertise in IT information, computer sciences related topics and other units like chemistry, Business, law, biology, biochemistry, and genetics. I'm a network and IT admin with +8 years of experience in all kind of environments.
I can help you in the following areas:
Networking
- Ethernet, Wireless Airmax and 802.11, fiber networks on GPON/GEPON and WDM
- Protocols and IP Services: VLANs, LACP, ACLs, VPNs, OSPF, BGP, RADIUS, PPPoE, DNS, Proxies, SNMP
- Vendors: MikroTik, Ubiquiti, Cisco, Juniper, HP, Dell, DrayTek, SMC, Zyxel, Furukawa Electric, and many more
- Monitoring Systems: PRTG, Zabbix, Whatsup Gold, TheDude, RRDtoo
Always available for new projects! Contact me for any inquiries
1+ Reviews
10+ Question Solved
Related Book For 

Principles of Managerial Finance
ISBN: 978-0134476315
15th edition
Authors: Chad J. Zutter, Scott B. Smart
Question Posted:
