A small regional airline wishes to predict sales for its business class between two cities for the
Question:
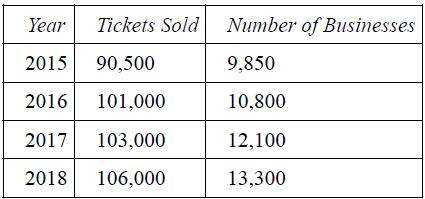
A small regional airline wishes to predict sales for its business class between two cities for the year 2019. The airline has recorded the following data for its past ten years: ticket sold and the number of businesses within its market area.
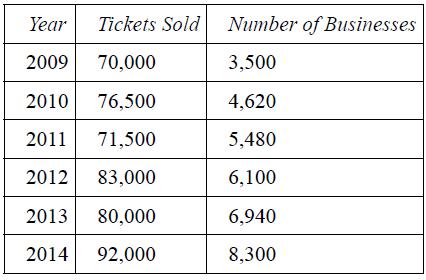
a. Plot the annual sales data (PAX) against the number of businesses (BUS) in the market area and draw in the “line of best fit” that seems to be visually appropriate.
b. Measure the intercept and slope of the above line of best fit, and state the approximate function relationship between the two variables.
c. Suppose the number of businesses is projected as increasing to 16,500 in 2019. Use the above function relationship to forecast the demand.
d. Comment on the probable accuracy of your forecast.
Step by Step Answer:

This question has not been answered yet.
You can Ask your question!