

The following diagram illustrates the demand curve facing a monopoly in an industry with no economies or
Question:
The following diagram illustrates the demand curve facing a monopoly in an industry with no economies or diseconomies of scale and no fixed costs. In the short and long run, MC = ATC. Copy the diagram and indicate the following:
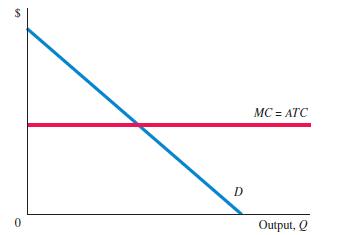
a. Optimal output
b. Optimal price
c. Total revenue
d. Total cost
e. Total monopoly profits
f. Total “excess burden” or “welfare costs” of the monopoly (briefly explain)
Fantastic news! We've Found the answer you've been seeking!
Step by Step Answer:
The monopoly firm ...View the full answer

Answered By
Patrick Busaka
I am a result oriented and motivated person with passion for challenges because they provide me an opportunity to grow professionally.
38+ Reviews
58+ Question Solved
Related Book For 

Principles Of Economics
ISBN: 9781292294698
13th Global Edition
Authors: Karl E. Case, Ray C. Fair, Sharon E. Oster
Question Posted:
