

The following graph depicts an IS curve for the economy. a. How does the output gap change
Question:
The following graph depicts an IS curve for the economy.
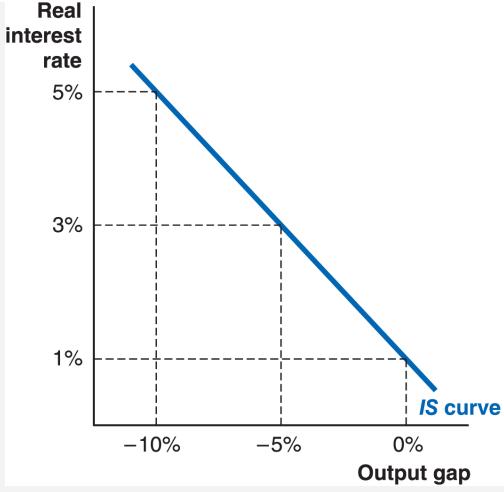
a. How does the output gap change if the real interest rate rises from 1% to 3%?
b. Explain the process by which the output gap changed. How did the change in the real interest rate affect aggregate expenditure?
c. How do actual output and potential output change?
Step by Step Answer:

This question has not been answered yet.
You can Ask your question!
Related Book For 
Principles Of Economics
ISBN: 9781319330156,9781319419769
2nd Edition
Authors: Betsey Stevenson, Justin Wolfers
Question Posted:
