

The table below contains data on per person income and per person consumption in the United States
Question:
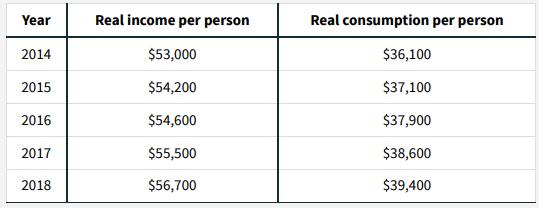
The table below contains data on per person income and per person consumption in the United States for several years.
a. Draw the consumption function for the United States for these years.
b. What is savings at each level of income?
c. Between 2014 and 2018, how much did income rise? What about consumption? What was the marginal propensity to consume out of the increase?
Step by Step Answer:

This question has not been answered yet.
You can Ask your question!
Related Book For 

Question Posted:
