

In practice, bar charts are used occasionally to summarize a numerical variable over time, which can be
Question:
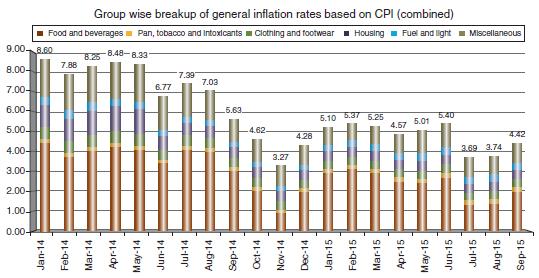
In practice, bar charts are used occasionally to summarize a numerical variable over time, which can be handy. The bar chart below shows the inflation rate based on the Consumer Price Index in India. For each month, inflation rate is grouped by product class, and class rectangle heights are based on the percentage the product group contributed to inflation rate.
a) What is the inflation rate for September 2014?
b) Which product group consistently has the highest impact on inflation rate?
c) Which product group consistently has the least impact on inflation rate?
d) During what month and year does it seem that the Miscellaneous product group accounted for the biggest percentage of the inflation rate?
Step by Step Answer:


Principles Of Managerial Statistics And Data Science
ISBN: 9781119486411
1st Edition
Authors: Roberto Rivera
