

For the demand curve shown in Figure 4.11, draw a separate graph showing how total expenditure varies
Question:
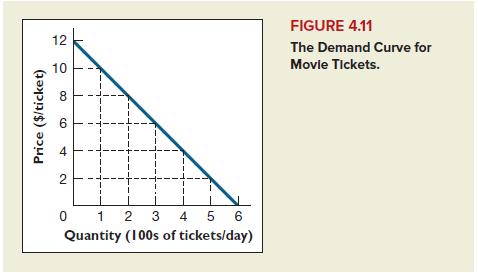
For the demand curve shown in Figure 4.11, draw a separate graph showing how total expenditure varies with the price of movie tickets.
Data from Figure 4.11
Step by Step Answer:

This question has not been answered yet.
You can Ask your question!
Related Book For 
Principles Of Microeconomics
ISBN: 9780073517858
6th Edition
Authors: Robert Frank, Ben Bernanke, Kate Antonovics, Ori Heffetz
Question Posted:
