

The following table contains data compiled by the Organisation for Economic Co-operation and Development (OECD). The data
Question:
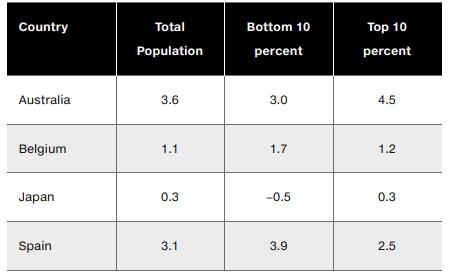
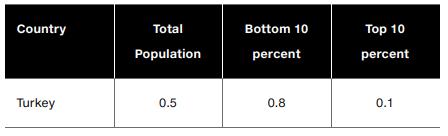
The following table contains data compiled by the Organisation for Economic Co-operation and Development (OECD). The data reflects the average annual percentage change in real household income by income group from the mid-1980s to the late-2000s for five OECD countries. For each of the listed countries, average annual real income increased for the overall population, as is shown in the “Total Population” column, but the numbers vary somewhat for the top 10 percent and bottom 10 percent of income earners within each country. Based on this data, explain what should have happened to the Gini coefficient for each of these countries during this timeframe.
Step by Step Answer:
The Gini coefficient is a measure of statistical dispersion intended to represent the income distribution of a nations residents It ranges from 0 to 1 ...View the full answer


Mylab Economics With Pearson Access Code For Principles Of Microeconomics
ISBN: 9780135197141,9780135197103
13th Edition
Authors: Karl E. Case; Ray C. Fair; Sharon E. Oster
