

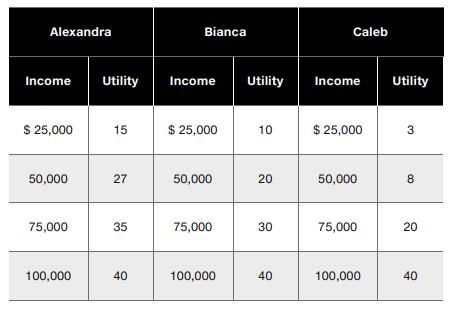
The following table shows the relationship between utility and income for three individuals. Show each relationship graphically
Question:
The following table shows the relationship between utility and income for three individuals. Show each relationship graphically and explain whether each person is risk-averse, risk-neutral, or risk-loving.
Fantastic news! We've Found the answer you've been seeking!
Step by Step Answer:
To analyze the risk attitudes of Alexandra Bianca and Caleb based on their utilityincome relationshi...View the full answer

Answered By
Utsab mitra
I have the expertise to deliver these subjects to college and higher-level students. The services would involve only solving assignments, homework help, and others.
I have experience in delivering these subjects for the last 6 years on a freelancing basis in different companies around the globe. I am CMA certified and CGMA UK. I have professional experience of 18 years in the industry involved in the manufacturing company and IT implementation experience of over 12 years.
I have delivered this help to students effortlessly, which is essential to give the students a good grade in their studies.
2+ Reviews
10+ Question Solved
Related Book For 

Mylab Economics With Pearson Access Code For Principles Of Microeconomics
ISBN: 9780135197141,9780135197103
13th Edition
Authors: Karl E. Case; Ray C. Fair; Sharon E. Oster
Question Posted:
