

The long-run average cost curve for an industry is represented in the following graph. Add short-run average
Question:
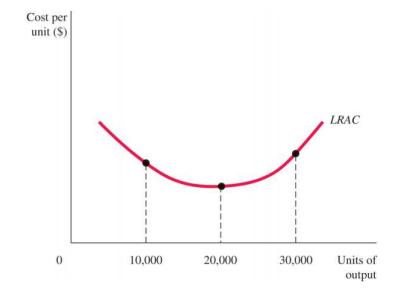
The long-run average cost curve for an industry is represented in the following graph. Add short-run average cost curves and short-run marginal cost curves for three firms in this industry, with one firm producing an output of 10,000 units, one firm producing an output of 20,000, and one firm producing an output of 30,000. Label these as Scale 1, Scale 2, and Scale 3, respectively. What is likely to happen to the scale of each of these three firms in the long run?
Step by Step Answer:

This question has not been answered yet.
You can Ask your question!
Related Book For 

Mylab Economics With Pearson Access Code For Principles Of Microeconomics
ISBN: 9780135197141,9780135197103
13th Edition
Authors: Karl E. Case; Ray C. Fair; Sharon E. Oster
Question Posted:
