

The following table shows the production figures (x_{i}) of cars of a company over a time period
Question:
The following table shows the production figures \(x_{i}\) of cars of a company over a time period of 12 years (in \(10^{3}\) ).
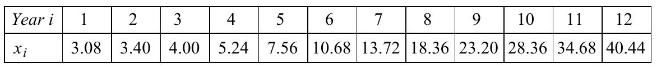
(1) Draw a time series plot. Is the underlying trend function linear?
(2) Smooth the time series \(\left\{x_{i}\right\}\) by the Epanechnikov kernel with bandwidth \([-2,+2]\).
(3) Smooth the time series \(\left\{x_{i}\right\}\) by exponential smoothing with parameter \(\lambda=0.6\) and predict the output for year 13 by the recursive equation (6.31).
Data from 6.31

Fantastic news! We've Found the answer you've been seeking!
Step by Step Answer:

Answered By
Deborah Joseph
My experience has a tutor has helped me with learning and relearning. You learn everyday actually and there are changes that are made to the curriculum every time so being a tutor has helped in keeping me updated about the present curriculum and all.
I have also been able to help over 100 students achieve better grades particularly in the categories of Math and Biology both in their internal examinations and external examinations.
2+ Reviews
10+ Question Solved
Related Book For 

Applied Probability And Stochastic Processes
ISBN: 9780367658496
2nd Edition
Authors: Frank Beichelt
Question Posted:
