

Exhibit 12 displays the long-run average total cost curve (LRAC US ) and the short-run average total
Question:
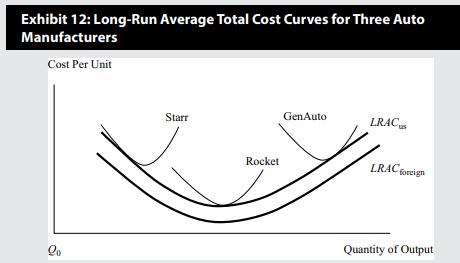
Exhibit 12 displays the long-run average total cost curve (LRACUS) and the short-run average total cost curves for three hypothetical US-based automobile manufacturers—Starr Vehicles (Starr), Rocket Sports Cars (Rocket), and General Auto (GenAuto). The LRAC curve for foreign-owned automobile companies that compete in the US auto market (LRACforeign) is also indicated in the graph. (The market structure implicit in the exhibit is imperfect competition.)
To what extent are the cost relationships depicted in Exhibit 12 useful for an economic and financial analysis of the three US-based auto firms?
Fantastic news! We've Found the answer you've been seeking!
Step by Step Answer:
First it is observable that the foreign auto companies have a lower LRAC compared with that of the U...View the full answer

Answered By
Joram mutua
I am that writer who gives his best for my student/client. Anything i do, i give my best. I have tutored for the last five years and non of my student has ever failed, they all come back thanking me for the best grades. I have a degree in economics, but i have written academic papers for various disciplines due to top-notch research Skills.In additional, I am a professional copywriter and proofreader.
2+ Reviews
10+ Question Solved
Related Book For 

Question Posted:
