Which of Olabudos observations of forecasting is correct? A. Only Observation 1 B. Only Observation 2 C.
Question:
Which of Olabudo’s observations of forecasting is correct?
A. Only Observation 1 B. Only Observation 2 C. Both Observation 1 and Observations 2 Doug Abitbol is a portfolio manager for Polyi Investments, a hedge fund that trades in the United States. Abitbol manages the hedge fund with the help of Robert Olabudo, a junior portfolio manager. Abitbol looks at economists’ inflation forecasts and would like to examine the relationship between the US Consumer Price Index (US CPI) consensus forecast and the actual US CPI using regression analysis. Olabudo estimates regression coefficients to test whether the consensus forecast is unbiased. If the consensus forecasts are unbiased, the intercept should be 0.0 and the slope will be equal to 1.0. Regression results are presented in Exhibit 1. Additionally, Olabudo calculates the 95 percent prediction interval of the actual CPI using a US CPI consensus forecast of 2.8.
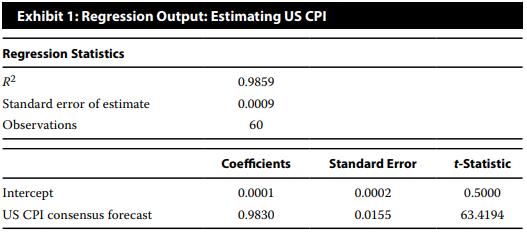
1. The absolute value of the critical value for the t-statistic is 2.002 at the 5 percent level of significance.
2. The standard deviation of the US CPI consensus forecast is sx = 0.7539.
3. The mean of the US CPI consensus forecast is _ X = 1.3350.
Finally, Abitbol and Olabudo discuss the forecast and forecast interval:
■ Observation 1. For a given confidence level, the forecast interval is the same no matter the US CPI consensus forecast.
■ Observation 2. A larger standard error of the estimate will result in a wider confidence interval.
Elena Vasileva recently joined EnergyInvest as a junior portfolio analyst. Vasileva’s supervisor asks her to evaluate a potential investment opportunity in Amtex, a multinational oil and gas corporation based in the United States. Vasileva’s supervisor suggests using regression analysis to examine the relation between Amtex shares and returns on crude oil.
Vasileva notes the following assumptions of regression analysis:
■ Assumption 1. The error term is uncorrelated across observations.
■ Assumption 2. The variance of the error term is the same for all observations.
■ Assumption 3. The dependent variable is normally distributed.
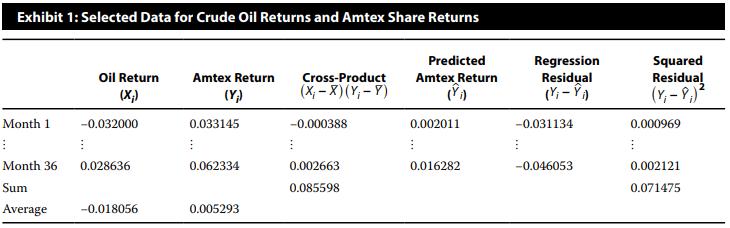
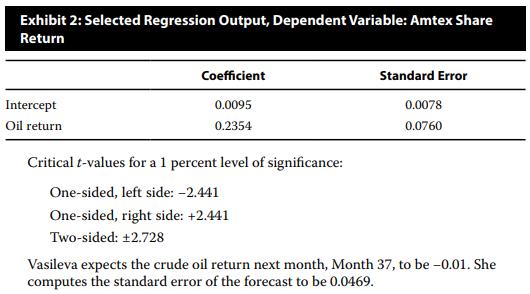
Vasileva runs a regression of Amtex share returns on crude oil returns using the monthly data she collected. Selected data used in the regression are presented in Exhibit 1, and selected regression output is presented in Exhibit 2. She uses a 1 percent level of significance in all her tests.
Step by Step Answer:
B is correct The confidence level influences the width of the forecast interv...View the full answer