

The apparatus in the figure can follow the course of an EDTA titration and was used to
Question:
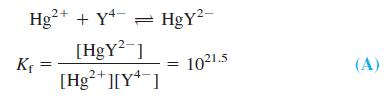
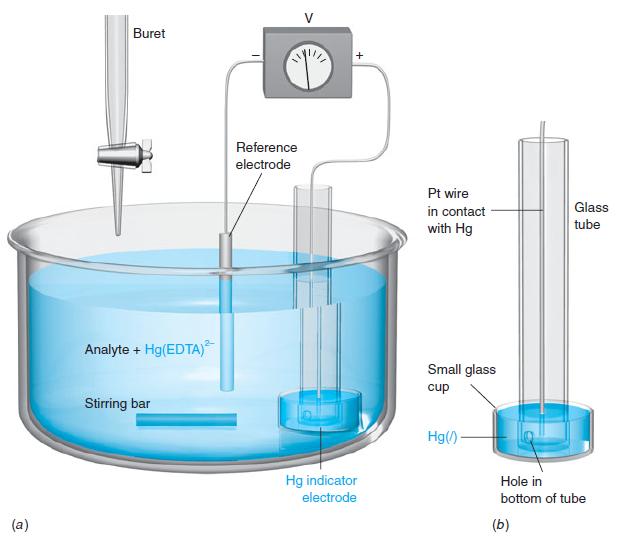
The apparatus in the figure can follow the course of an EDTA titration and was used to generate the curves in Figure 11-10. The heart of the cell is a pool of liquid Hg in contact with the solution and with a Pt wire. A small amount of HgY2- added to the analyte equilibrates with a very tiny amount of Hg2+:
The redox equilibrium 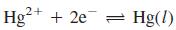 is established rapidly at the surface of the Hg electrode, so the Nernst equation for the cell can be written in the form
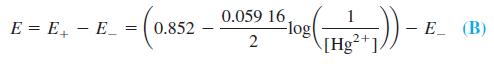
where E- is the constant potential of the reference electrode. From Equation A, [Hg2+] = [HgY2-] / Kf[Y4-], and this can be substituted into Equation B to give
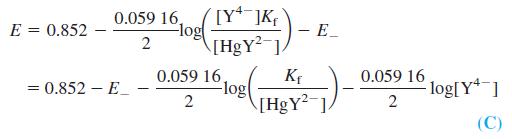
where Kf is the formation constant for HgY2-. This apparatus thus responds to the changing EDTA concentration during an EDTA titration.
Suppose that you titrate 50.0 mL of 0.010 0 M MgSO4 with 0.020 0 M EDTA at pH 10.0, using the apparatus in the figure with an S.C.E. reference electrode. Analyte contains 1.0 × 10⁻⁴ M Hg(EDTA)2- added at the beginning of the titration. Calculate the cell voltage at the following volumes of added EDTA, and draw a graph of millivolts versus milliliters: 0, 10.0, 20.0, 24.9, 25.0, and 26.0 mL.
Step by Step Answer:
The balanced equation for the titration reaction between Mg2 and EDTA is Mg2 EDTA4 MgEDTA2 The overa...View the full answer


