

1. Consider the following scenario to understand the relationship between marginal and average values. Suppose Dmitri is...
Question:
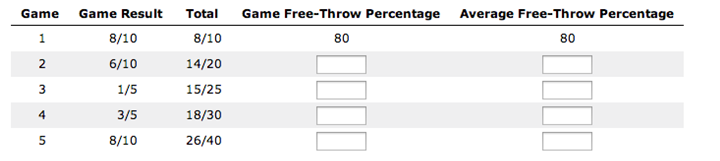
1. Consider the following scenario to understand the relationship between marginal and average values. Suppose Dmitri is a professional basketball player, and his game log for free throws can be summarized in the following table.
Fill in the columns with Dmitri's free-throw percentage for each game and his overall free-throw average after each game.
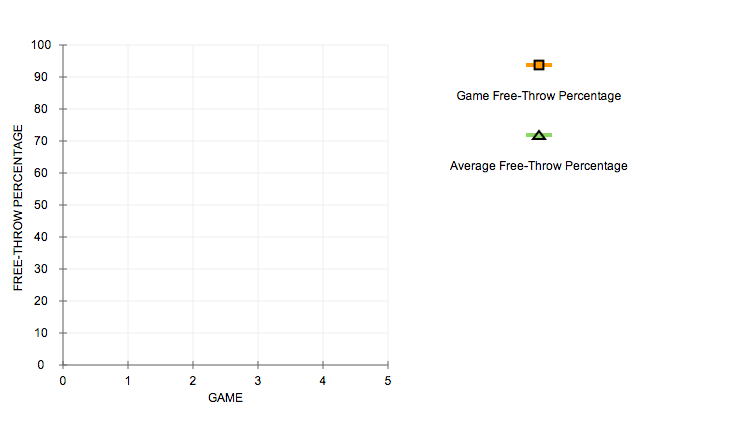
On the following graph, use the orange points (square symbol) to plot Dimitri's free-throw percentage for each game individually, and use the green points (triangle symbol) to plot his overall average free-throw percentage after each game.
Note: Plot your points in the order in which you would like them connected. Line segments will connect the automatically.
2. You can think of the result in any one game as being Dmitri's marginal free-throw percentage. Based on your previous answer, you can deduced that when Dmitri's marginal free-throw percentage is below the average, the average must be __________
You can now apply this analysis to production costs. For a U-shaped average total cost curve falling, when the marginal cost curve is below the average total cost curve, the average total cost must be ________. Also when the marginal cost rising above the average total cost curve, the average total cost must be __________. Therefore, the marginal cost curve intersects the average total cost curve___________.
Expert Answer:


Intermediate Microeconomics and Its Application
ISBN: 978-1133189039
12th edition
Authors: Walter Nicholson, Christopher M. Snyder
