

Given a scenario and a dataset (see attached excel file), you are required to run regression of
Question:
Given a scenario and a dataset (see attached excel file), you are required to run regression of the dataset, and present your results in a report. In your report, you should include an introduction which describes the case, the study purpose and the demand function as an equation which you would like to estimate and regression results in table. Following the introduction, you need to include the four steps to interpret the regression results:
The business objective facing the marking manager of a leading brand wine is to develop a model to estimate and predict monthly sales volume in supermarkets. Four independant variables are considered here: the price per bottle , as measured in dollars; the monthly budget for advertising , measured in 1000 dollars; the price of leading competitor's product, X measured in dollars; per capita income of the standard metropolitan statistical area (SMSA) in which the supermarkets is located, measured in 1000 dollars. The dependent variable is the number of bottles sold in a month, measured in 1000 . Data are collected from a sample of 19 supermarkets in different cities. Please conduct necessary analysis based on the data given.
| Store | Sales (1000) | Price ($) | Advertising ($1000) | Price X ($) | Income ($1000) |
| 1 | 3.5 | 80 | 3.3 | 61 | 4.9 |
| 2 | 4.6 | 60 | 3.3 | 49 | 5.4 |
| 3 | 3.5 | 78 | 3 | 49 | 4.8 |
| 4 | 4.3 | 65 | 4.5 | 54 | 5.1 |
| 5 | 3.5 | 70 | 3 | 53 | 4.5 |
| 6 | 3.8 | 75 | 4 | 49 | 4.3 |
| 7 | 4.3 | 45 | 3 | 62 | 5.6 |
| 8 | 4.7 | 55 | 3.7 | 55 | 5.8 |
| 9 | 4.5 | 70 | 3.5 | 63 | 5.7 |
| 10 | 4.9 | 55 | 4 | 59 | 5.5 |
| 11 | 3.4 | 75 | 3.5 | 49 | 4.9 |
| 12 | 3 | 75 | 3.2 | 56 | 4.3 |
| 13 | 4.4 | 59 | 4 | 53 | 5.9 |
| 14 | 4.5 | 56 | 3.5 | 61 | 6.1 |
| 15 | 3 | 80 | 2.7 | 53 | 4.8 |
| 16 | 3.5 | 78 | 3 | 54 | 4.7 |
| 17 | 4.2 | 75 | 3.5 | 62 | 5.7 |
| 18 | 4 | 70 | 3.5 | 49 | 5.3 |
| 19 | 4.6 | 60 | 3.7 | 54 | 5.9 |
Summary Output
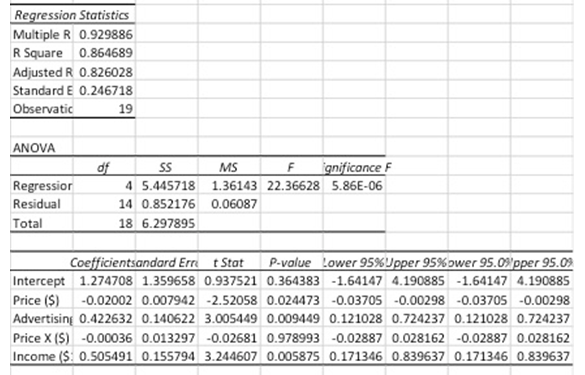
Step 1: interpret coefficient signs and magnitudes
Step 2: compute elasticity coefficient and interpret the elasticity?s. Please use data of Store 1 to compute elasticity?s, as shown below:
| Sales (1000) | Price ($) | Advertising ($1000) | Price X ($) | Income ($1000) |
| 3.5 | 80 | 3.3 | 61 | 4.9 |
Step 3: Statistical evaluation of regression results
Step 4: Analyze managerial decisions
Expert Answer:
1 From the given output we have the regression equation as y 12747 00200x 1 04226x 2 00004x 3 03055x ... View the full answer


Using Financial Accounting Information The Alternative to Debits and Credits
ISBN: 978-1133161646
7th Edition
Authors: Gary A. Porter, Curtis L. Norton
