

Recently, the annual number of driver deaths per 100,000 for the selected age groups was as follows:
Question:
Recently, the annual number of driver deaths per 100,000 for the selected age groups was as follows: 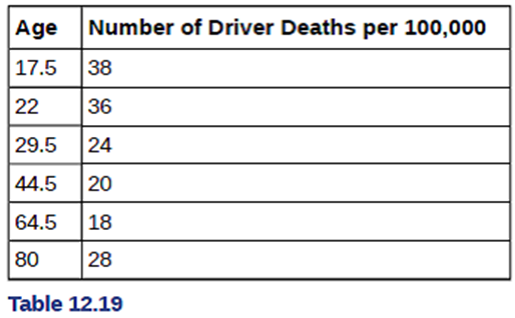
a. For each age group, pick the midpoint of the interval for the x value. (For the 75+ group, use 80.)
b. Using ?ages" as the independent variable and "Number of driver deaths per 100,000" as the dependent variable, make a scatter plot of the data.
c. Calculate the least squares (best-fit) line. Put the equation in the form of: y = a + bx
d. Find the correlation coefficient. Is it significant? e. Predict the number of deaths for ages 40 and 60.
f. Based on the given data, is there a linear relationship between age of a driver and driver fatality rate?
g. What is the slope of the least squares (best-fit) line? Interpret the slope.
Expert Answer:
a The data is shown below b While creating scatterplot consider Ages as an independent variable on X axis and consider Number of driver deaths per 100000 as a dependent variable on Y axis The scatterp... View the full answer


Data Analysis and Decision Making
ISBN: 978-0538476126
4th edition
Authors: Christian Albright, Wayne Winston, Christopher Zappe
