

Shown is a contour map of atmospheric pressure in North America on August 12,2008.On the level curves
Fantastic news! We've Found the answer you've been seeking!
Question:
Shown is a contour map of atmospheric pressure in North America on August 12,2008.On the level curves (called isobars) the pressure is indicated in milibars (mb).
(a) Estimate the pressure at C (Chicago), N (Nashville), S ( San Francisco), and V (Vancouver).
(b) At which of these locations were the winds strongest? 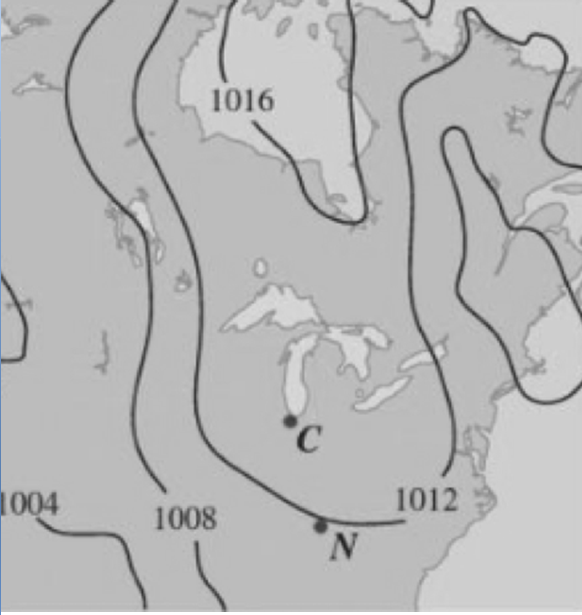
Expert Answer:
a Isobars are basically contours where airpressure is constant Looking at our graph we find that C C... View the full answer

Related Book For 

Posted Date:
