

The following data shows seasonal attendance at broadway theaters in New York City over a five year
Fantastic news! We've Found the answer you've been seeking!
Question:
The following data shows seasonal attendance at broadway theaters in New York City over a five year period.
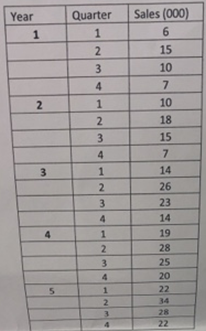
a. Plot the series indicate the appropriateness of seasonal and trend time series components.
b. Develop and produce the seasonal indexes after all your correction by multiple regression methods in Minitab.
c. Complete the final forecast for each quarter of year 6. The model should have both seasonality and trend.
Expert Answer:

Related Book For 

Statistics for Business and Economics
ISBN: 978-0321826237
12th edition
Authors: James T. McClave, P. George Benson, Terry T Sincich
Posted Date:
