The following graph approximates business cycles in the United States from the first quarter of 1955 to
Question:
The following graph approximates business cycles in the United States from the first quarter of 1955 to the third quarter of 1959. The vertical blue bar coincides with periods of 6 or more months of declining real gross domestic product (real GDP). 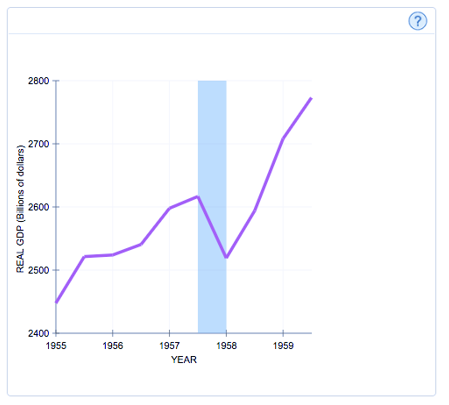
Notice that real GDP trends upawrd over time but experiences ups and downs in the short run. A period of declining real GDP, such as the blue-shaded period in 1957, is know ___________?
True or False: small ups and downs in real GDP follow a consistent, predictable pattern.
True
False
Which of the following probably occurred as the U.S economy experienced real GDP in 1957. Check all that apply.
Retail sales declined.
Industrial production increased.
Consumer spending declined.
The unemployment rate increased.
Expert Answer: