

The graph below depicts a market where a tariff is introduced. PW represents the world price and
Fantastic news! We've Found the answer you've been seeking!
Question:
The graph below depicts a market where a tariff is introduced. PW represents the world price and PT represents the domestic price with the introduction of the tariff so that the size of the tariff is equal the
difference between P: and PW. Note that the correct answer may include more than one area.
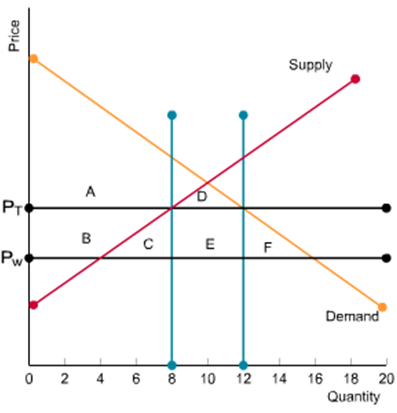
What area(s) represent the dead weight loss associated with the tariff?  What area(s) represent the government revenue generated by the tariff?

 How many imports are there after the introduction of the tariff?
Expert Answer:
Figure 1 represents a world market with a tariff In this figure PW and PT rep... View the full answer

Related Book For 

Microeconomics
ISBN: 9781464146978
1st edition
Authors: Austan Goolsbee, Steven Levitt, Chad Syverson
Posted Date:
