

Verik Engineering Company manufactures three different types of Calculators and classifies them as Scientific, Business and Graphing
Question:
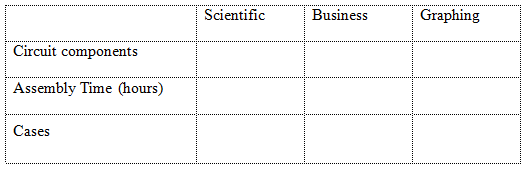
Verik Engineering Company manufactures three different types of Calculators and classifies them as Scientific, Business and Graphing according to their computing capabilities. The production requirements are as follows Each Scientific calculator requires five circuit components, one assembly hour and one case.
Each Business calculator requires seven circuit components, three assembly hours and one case.
Each Graphing calculator requires ten circuit components, four assembly hours and one case.
The company has a monthly limit of 90,000 circuit components, 30,000 labor hours and 9,000 cases. The unit profits on Scientific, Business, and Graphing calculators are $6, $13 and$20 respectively.
How many of each should be produced to yield the maximum profit?
What is the maximum profit?
a. Complete the production table below
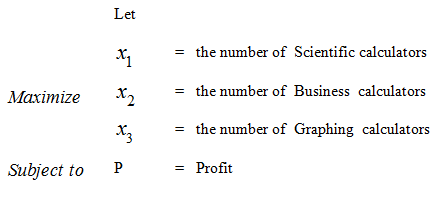
b. Construct the mathematical model for the linear programming problem.
Include the objective equation and the constraints in standard form.
b. Construct the mathematical model for the linear programming problem.
Include the objective equation and the constraints in standard form.
c. Introduce slack variables to obtain the initial system.
In order to answer questions d and e below you must first complete
Questions f, g and h below,
d. How many of each calculator should Columbia Engineering Company produce each month to maximize profit.
Scientific= ______ Business= ______ Graphing= ______
e. What is the maximum profit?
Maximum Profit = ______
f. Are there any unused circuit components, hours, or cases?
If there are, what are they and how many
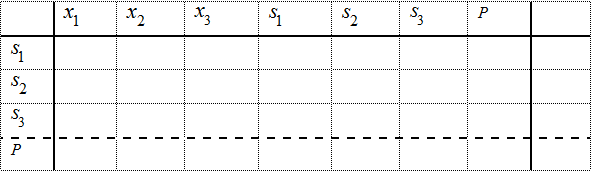
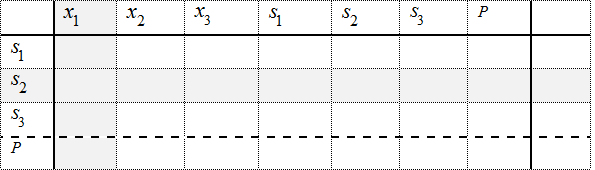
g. Set up the initial simplex tableau.
Circle the pivot element.
h. Now carry out successive pivoting operations to obtain an optimum solution to the linear programming problem. In each case clearly state the row operations used. For each tableau used, complete the leftmost column by providing the appropriate basic variables.
You must show all work leading to the final tableau.
Show your work in the following tables. You may need less than the seven tables provided for you.
The initial simplex tableau for this problem is:
Expert Answer:
a Complete the production table below S cientific B usiness G raphing Circuit components 5 7 10 Assembly Time hours 1 3 4 Cases 1 1 1 b Construct the ... View the full answer


Cost Management Measuring Monitoring and Motivating Performance
ISBN: 978-0470769423
2nd edition
Authors: Leslie G. Eldenburg, Susan K. Wolcott
