

1. Calculate the expected return (sample arithmetic mean) and sample standard deviation of returns of each...
Fantastic news! We've Found the answer you've been seeking!
Question:

Transcribed Image Text:
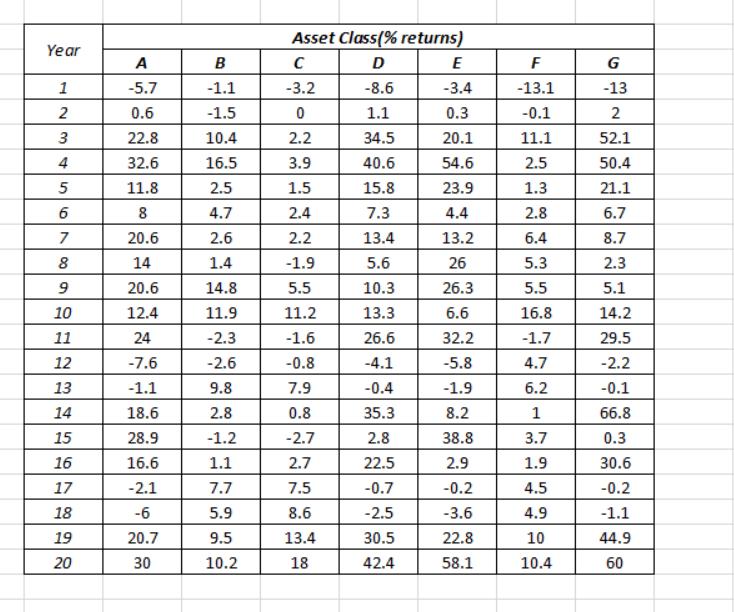
1. Calculate the expected return (sample arithmetic mean) and sample standard deviation of returns of each asset class. Also calculate the sample geometric mean average historical rate of return for each asset class. Comment on the relationship between arithmetic mean and geometric mean returns. (15%) 2. Calculate the correlation matrix of returns. Comment on the correlation matrix, with reference to the potential for risk reducing benefits from diversification across this set of assets. (10%) 3. Using the approach recommended in the instruction video on the course website, construct (i) a covariance matrix for the asset classes; (ii) a border- multiplied covariance matrix, based on an equally weighted risky-asset portfolio. (10%) 4. Construct a restricted minimum variance frontier and a restricted efficient frontier for these asset classes, using target expected rates of return of 4%, 5%, 6%, 7%, 8% , 9%, 10 % , 11%, 12%, 13%, 14%, 15%, 16%, 17% and 18%. Graph them. (10%) 5. Assuming a coefficient of risk aversion of 5 and assuming the investor is not able to borrow, identify which of the above target rates of return maximises the investor's utility. (5%) 6. Construct an unrestricted minimum variance frontier and an unrestricted efficient frontier for these asset classes, using target expected rates of return of 4%, 5%, 6%, 7%, 8%, 9%, 10 %, 11%, 12%, 13%, 14%, 15%, 16%, 17% and 18%. Graph them. (10%) 7. Assuming a coefficient of risk aversion of 5 and assuming the investor is not able to borrow, identify which of the above target rates of return maximises the investor's utility. (5%) 8. Explain the reasons for any difference between the utility-maximising target expected rate of return in questions 5 and 7. (5%) 9. Now assume it is possible for the investor to borrow funds at a rate of interest of 1.5% per annum, which is also the rate of interest on the risk-free asset, but it is not permitted to short-sell risky assets. Draw a capital allocation line onto the diagram. Show that it is now possible to obtain the same target expected rate of return you identified in question 5, but at lower risk. What combined portfolio should be selected if the aim is to maximise investor utility, based on the restricted frontier and the capital allocation line? (15%) 10. What assumptions have you made when undertaking the above analysis? Suppose that economic conditions have changed, so that expected returns on risky assets are lower than during the sample period, risks are higher and correlations are higher. What would this imply? In what sense is fundamental uncertainty of relevance to investment analysts and those who offer investment advice? (15%) Year 1 2 3 4 5 6 7 8 9 10 11 12 13 14 15 16 17 18 19 20 A -5.7 0.6 22.8 32.6 11.8 8 20.6 14 20.6 12.4 24 -7.6 -1.1 18.6 28.9 16.6 -2.1 -6 20.7 30 B -1.1 -1.5 10.4 16.5 2.5 4.7 2.6 1.4 14.8 11.9 -2.3 -2.6 9.8 2.8 -1.2 1.1 7.7 5.9 9.5 10.2 Asset Class(% returns) C D -3.2 -8.6 0 1.1 2.2 34.5 3.9 40.6 1.5 15.8 2.4 7.3 2.2 13.4 -1.9 5.6 5.5 10.3 11.2 13.3 -1.6 26.6 -0.8 -4.1 7.9 -0.4 0.8 35.3 -2.7 2.8 2.7 22.5 7.5 -0.7 8.6 -2.5 13.4 30.5 18 42.4 E -3.4 0.3 20.1 54.6 23.9 4.4 13.2 26 26.3 6.6 32.2 -5.8 -1.9 8.2 38.8 2.9 -0.2 -3.6 22.8 58.1 F -13.1 -0.1 11.1 2.5 1.3 2.8 6.4 5.3 5.5 16.8 -1.7 4.7 6.2 1 3.7 1.9 4.5 4.9 10 10.4 G -13 2 52.1 50.4 21.1 6.7 8.7 2.3 5.1 14.2 29.5 -2.2 -0.1 66.8 0.3 30.6 -0.2 -1.1 44.9 60 1. Calculate the expected return (sample arithmetic mean) and sample standard deviation of returns of each asset class. Also calculate the sample geometric mean average historical rate of return for each asset class. Comment on the relationship between arithmetic mean and geometric mean returns. (15%) 2. Calculate the correlation matrix of returns. Comment on the correlation matrix, with reference to the potential for risk reducing benefits from diversification across this set of assets. (10%) 3. Using the approach recommended in the instruction video on the course website, construct (i) a covariance matrix for the asset classes; (ii) a border- multiplied covariance matrix, based on an equally weighted risky-asset portfolio. (10%) 4. Construct a restricted minimum variance frontier and a restricted efficient frontier for these asset classes, using target expected rates of return of 4%, 5%, 6%, 7%, 8% , 9%, 10 % , 11%, 12%, 13%, 14%, 15%, 16%, 17% and 18%. Graph them. (10%) 5. Assuming a coefficient of risk aversion of 5 and assuming the investor is not able to borrow, identify which of the above target rates of return maximises the investor's utility. (5%) 6. Construct an unrestricted minimum variance frontier and an unrestricted efficient frontier for these asset classes, using target expected rates of return of 4%, 5%, 6%, 7%, 8%, 9%, 10 %, 11%, 12%, 13%, 14%, 15%, 16%, 17% and 18%. Graph them. (10%) 7. Assuming a coefficient of risk aversion of 5 and assuming the investor is not able to borrow, identify which of the above target rates of return maximises the investor's utility. (5%) 8. Explain the reasons for any difference between the utility-maximising target expected rate of return in questions 5 and 7. (5%) 9. Now assume it is possible for the investor to borrow funds at a rate of interest of 1.5% per annum, which is also the rate of interest on the risk-free asset, but it is not permitted to short-sell risky assets. Draw a capital allocation line onto the diagram. Show that it is now possible to obtain the same target expected rate of return you identified in question 5, but at lower risk. What combined portfolio should be selected if the aim is to maximise investor utility, based on the restricted frontier and the capital allocation line? (15%) 10. What assumptions have you made when undertaking the above analysis? Suppose that economic conditions have changed, so that expected returns on risky assets are lower than during the sample period, risks are higher and correlations are higher. What would this imply? In what sense is fundamental uncertainty of relevance to investment analysts and those who offer investment advice? (15%) 1. Calculate the expected return (sample arithmetic mean) and sample standard deviation of returns of each asset class. Also calculate the sample geometric mean average historical rate of return for each asset class. Comment on the relationship between arithmetic mean and geometric mean returns. (15%) 2. Calculate the correlation matrix of returns. Comment on the correlation matrix, with reference to the potential for risk reducing benefits from diversification across this set of assets. (10%) 3. Using the approach recommended in the instruction video on the course website, construct (i) a covariance matrix for the asset classes; (ii) a border- multiplied covariance matrix, based on an equally weighted risky-asset portfolio. (10%) 4. Construct a restricted minimum variance frontier and a restricted efficient frontier for these asset classes, using target expected rates of return of 4%, 5%, 6%, 7%, 8% , 9%, 10 % , 11%, 12%, 13%, 14%, 15%, 16%, 17% and 18%. Graph them. (10%) 5. Assuming a coefficient of risk aversion of 5 and assuming the investor is not able to borrow, identify which of the above target rates of return maximises the investor's utility. (5%) 6. Construct an unrestricted minimum variance frontier and an unrestricted efficient frontier for these asset classes, using target expected rates of return of 4%, 5%, 6%, 7%, 8%, 9%, 10 %, 11%, 12%, 13%, 14%, 15%, 16%, 17% and 18%. Graph them. (10%) 7. Assuming a coefficient of risk aversion of 5 and assuming the investor is not able to borrow, identify which of the above target rates of return maximises the investor's utility. (5%) 8. Explain the reasons for any difference between the utility-maximising target expected rate of return in questions 5 and 7. (5%) 9. Now assume it is possible for the investor to borrow funds at a rate of interest of 1.5% per annum, which is also the rate of interest on the risk-free asset, but it is not permitted to short-sell risky assets. Draw a capital allocation line onto the diagram. Show that it is now possible to obtain the same target expected rate of return you identified in question 5, but at lower risk. What combined portfolio should be selected if the aim is to maximise investor utility, based on the restricted frontier and the capital allocation line? (15%) 10. What assumptions have you made when undertaking the above analysis? Suppose that economic conditions have changed, so that expected returns on risky assets are lower than during the sample period, risks are higher and correlations are higher. What would this imply? In what sense is fundamental uncertainty of relevance to investment analysts and those who offer investment advice? (15%) Year 1 2 3 4 5 6 7 8 9 10 11 12 13 14 15 16 17 18 19 20 A -5.7 0.6 22.8 32.6 11.8 8 20.6 14 20.6 12.4 24 -7.6 -1.1 18.6 28.9 16.6 -2.1 -6 20.7 30 B -1.1 -1.5 10.4 16.5 2.5 4.7 2.6 1.4 14.8 11.9 -2.3 -2.6 9.8 2.8 -1.2 1.1 7.7 5.9 9.5 10.2 Asset Class(% returns) C D -3.2 -8.6 0 1.1 2.2 34.5 3.9 40.6 1.5 15.8 2.4 7.3 2.2 13.4 -1.9 5.6 5.5 10.3 11.2 13.3 -1.6 26.6 -0.8 -4.1 7.9 -0.4 0.8 35.3 -2.7 2.8 2.7 22.5 7.5 -0.7 8.6 -2.5 13.4 30.5 18 42.4 E -3.4 0.3 20.1 54.6 23.9 4.4 13.2 26 26.3 6.6 32.2 -5.8 -1.9 8.2 38.8 2.9 -0.2 -3.6 22.8 58.1 F -13.1 -0.1 11.1 2.5 1.3 2.8 6.4 5.3 5.5 16.8 -1.7 4.7 6.2 1 3.7 1.9 4.5 4.9 10 10.4 G -13 2 52.1 50.4 21.1 6.7 8.7 2.3 5.1 14.2 29.5 -2.2 -0.1 66.8 0.3 30.6 -0.2 -1.1 44.9 60 Year 1 2 3 4 5 6 7 8 9 10 11 12 13 14 15 16 17 18 19 20 A -5.7 0.6 22.8 32.6 11.8 8 20.6 14 20.6 12.4 24 -7.6 -1.1 18.6 28.9 16.6 -2.1 -6 20.7 30 B -1.1 -1.5 10.4 16.5 2.5 4.7 2.6 1.4 14.8 11.9 -2.3 -2.6 9.8 2.8 -1.2 1.1 7.7 5.9 9.5 10.2 Asset Class(% returns) C D -3.2 -8.6 0 1.1 2.2 34.5 3.9 40.6 1.5 15.8 2.4 7.3 2.2 13.4 -1.9 5.6 5.5 10.3 11.2 13.3 -1.6 26.6 -0.8 -4.1 7.9 -0.4 0.8 35.3 -2.7 2.8 2.7 22.5 7.5 -0.7 8.6 -2.5 13.4 30.5 18 42.4 E -3.4 0.3 20.1 54.6 23.9 4.4 13.2 26 26.3 6.6 32.2 -5.8 -1.9 8.2 38.8 2.9 -0.2 -3.6 22.8 58.1 F -13.1 -0.1 11.1 2.5 1.3 2.8 6.4 5.3 5.5 16.8 -1.7 4.7 6.2 1 3.7 1.9 4.5 4.9 10 10.4 G -13 2 52.1 50.4 21.1 6.7 8.7 2.3 5.1 14.2 29.5 -2.2 -0.1 66.8 0.3 30.6 -0.2 -1.1 44.9 60
Expert Answer:
Answer rating: 100% (QA)
1 The average annual returns standard deviations and geometric mean return... View the full answer

Related Book For 
Microsoft Excel Data Analysis And Business Modeling
ISBN: 9780137613663
7th Edition
Authors: Wayne Winston
Posted Date:
Students also viewed these finance questions
-
In Figure 3,4, C is the event that an ore contains and U is the event that it contains uranium. Explain in copper (a) region 5; (b) regions 4 and 6 together; (c) regions 7 and 8 together; d) regions...
-
Thor Bhd. (Thor) is a listed company in Malaysia, specializes in selling batteries. At 31 December 2021, Thor holds four distinct types of batteries in its warehouse. The accountant of Thor provided...
-
The following characteristics are related to either periodic inventory or perpetual inventory systems. A. Purchases of inventory are journalized to an asset account at the time of purchase. B....
-
Consider the physical system of Problem 7.119 (a series of water-filled trays heated radiatively), but under operating conditions for which each tray is 0.25 m long by 1 m wide and is uniformly...
-
Alternatives 1, 2, and 3 have lives of 3, 4, and 6 years, respectively. Their net cash flow (NCF) and salvage value (SV) profiles are as follows: Additional explanation is necessary: The NCF profile...
-
Gross Profit Calculations and Repossessed Merchandise Basler Corporation, which began business on January 1, 2010, appropriately uses the installment-sales method of accounting. The following data...
-
Our company makes school buses. Here is some data on the cost of producing these vehicles. Monthly Production Data Output 0 1 2 3 4 5 6 7 8 9 10 Total cost 200,000 400,000 575,000 725,000 850,000...
-
Tony and Suzie see the need for a rugged all-terrain vehicle to transport participants and supplies. They decide to purchase a used Suburban on July 1, 2022, for $12,000. They expect to use the...
-
The owner of Office Furniture is concerned about cash management in the following two months, July and August 2021, and asked you to prepare a cash budget for these months. You have the following...
-
Identify and discuss the traits of proactive personalities. Describe the relationship between job satisfaction and organizational citizenship behavior (OCB). How do you exhibit OCB as either a...
-
As a counselor, why is it important to consider the client's perspective in a counseling session? How can Social and Cultural Diversity Issues and Co-Occurring Disorders applied?
-
Justine is studying at TAFE NSW in Sydney. She discovers that there is $2 million dollars in her bank account. She presumes that the bank has made an error. Justine has been a problem gambler for...
-
1. Why is selling (or buying) diamonds over the Internet difficult? 2. How has Blue Nile built its supply chain to keep costs low? 3. How has Blue Nile reduced consumer anxiety over online diamond...
-
Cost per Equivalent Unit The cost of direct materials transferred into the Rolling Department of Oak Ridge Steel Company is $468,000. The conversion cost for the period in the Rolling Department is...
-
Evaluate te ff (1)' (1)3 +(1) 3! (1)" + . 11! 5! 7! 9! and compare its value to the value of sin 1. (1)0- (1)2 +4(1)4+ - (1) + (1) (1)10 + - ... 6! 10! and compare its value to the value of cos 1.
-
In the figure, two loudspeakers, separated by a distance of d1 = 2.63 m, are in phase. Assume the amplitudes of the sound from the speakers are approximately the same at the position of a listener,...
-
Find all transactions in which Hallagan sold eyeliner in the West region.
-
A prescription drug is produced in the United States and sold internationally. Each unit of the drug costs $60 to produce. In the German market, the drug sells for 150 per unit. The current exchange...
-
A roulette wheel contains the numbers 0, 00, 1, 2, ..., 36. Suppose you bet on each of 25 spins that 00 will show. After 25 spins, what is the chance you have won at least once?
-
Consider the logistic map discussed in the text. To gauge the density of bifurcations, one uses a measure of distance between fixed points as follows. Define \(d=x^{*}-(1 / 2)\) as the distance...
-
Consider the equation of motion \[\frac{d^{2} u}{d \varphi^{2}}+u-\frac{1}{p}=3 \lambda u^{2}\] where \(p\) and \(\lambda\) are constants. Find the solution using perturbation theory to first order...
-
Using numerical methods, solve the differential equation \[\frac{d q}{d t}=-\alpha q+\beta\] Compare your results with the exact solution as a function of the discrete time-step you use, and the...

Study smarter with the SolutionInn App