

1 2 3 Revenue 5 6 Total Revenue (Credit) 7 Cost of Revenue 8 Gross Profit...
Fantastic news! We've Found the answer you've been seeking!
Question:
Transcribed Image Text:
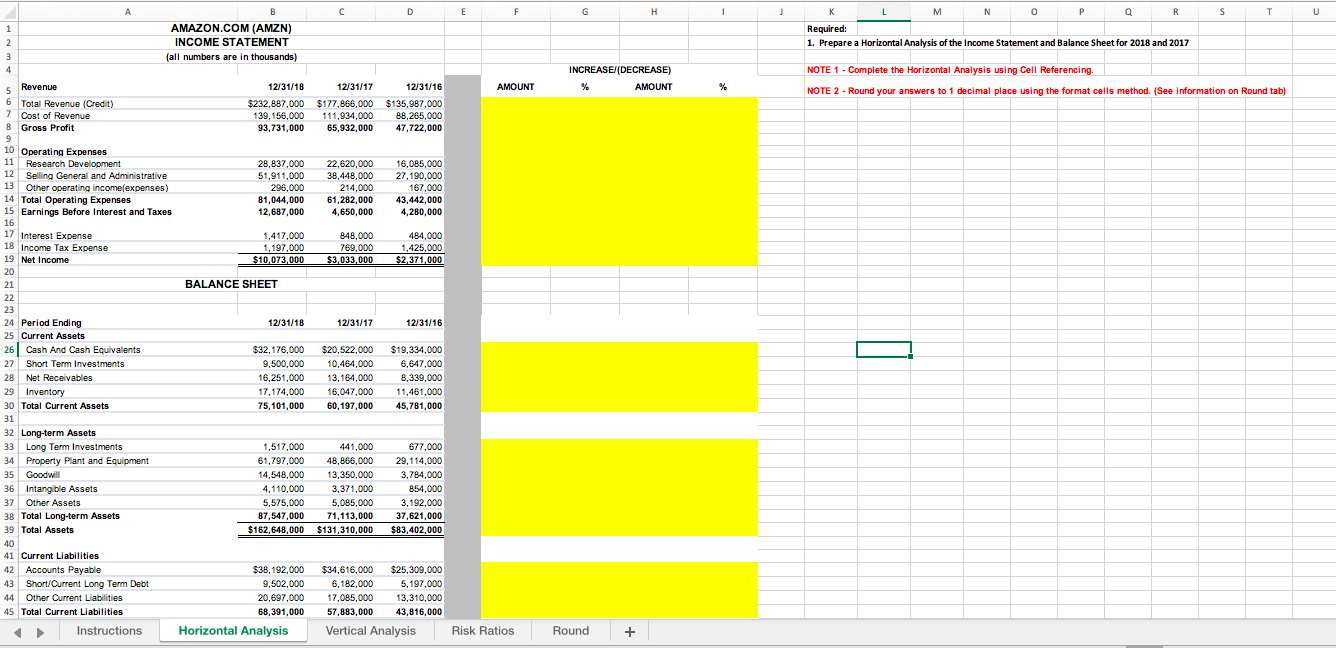
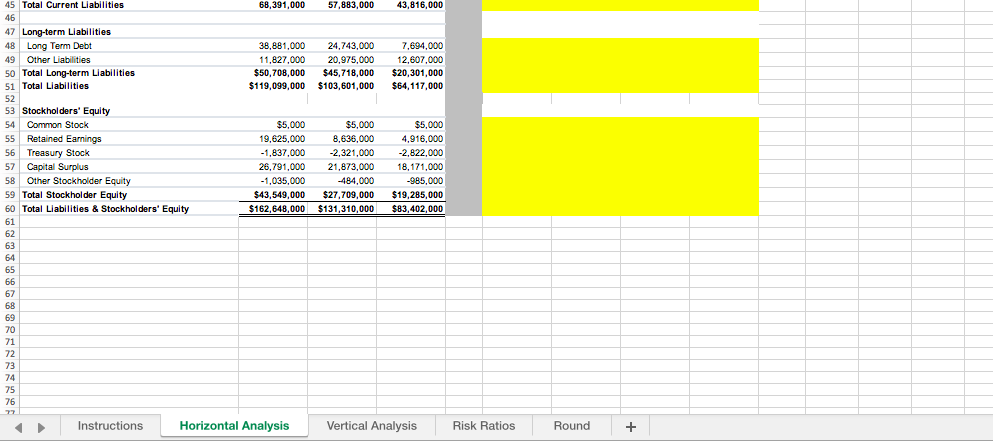
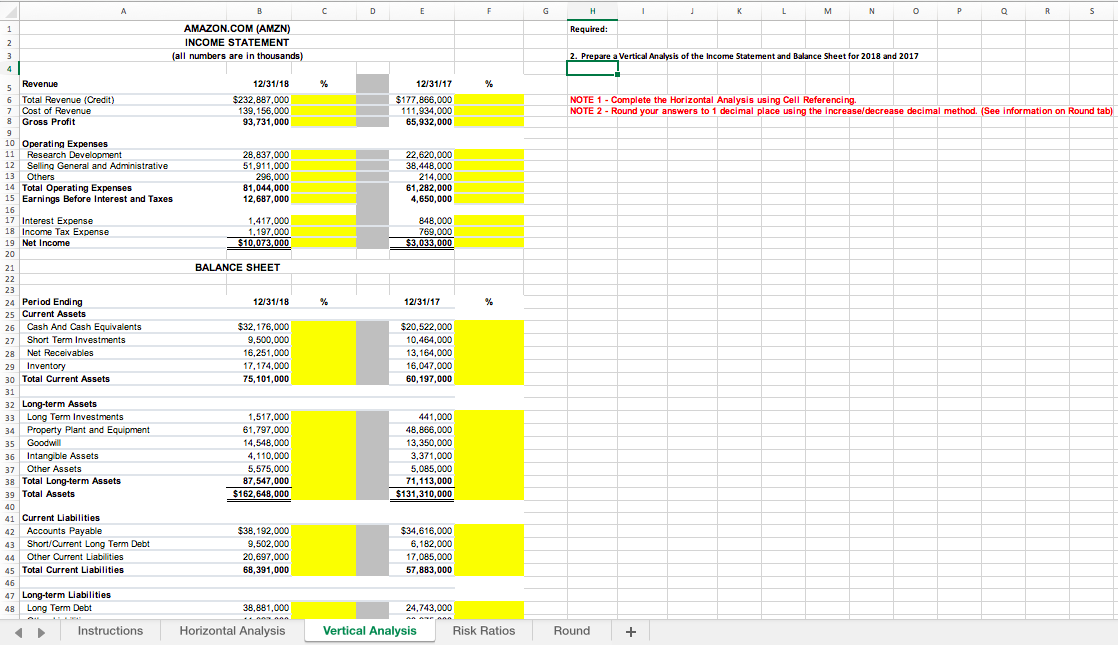
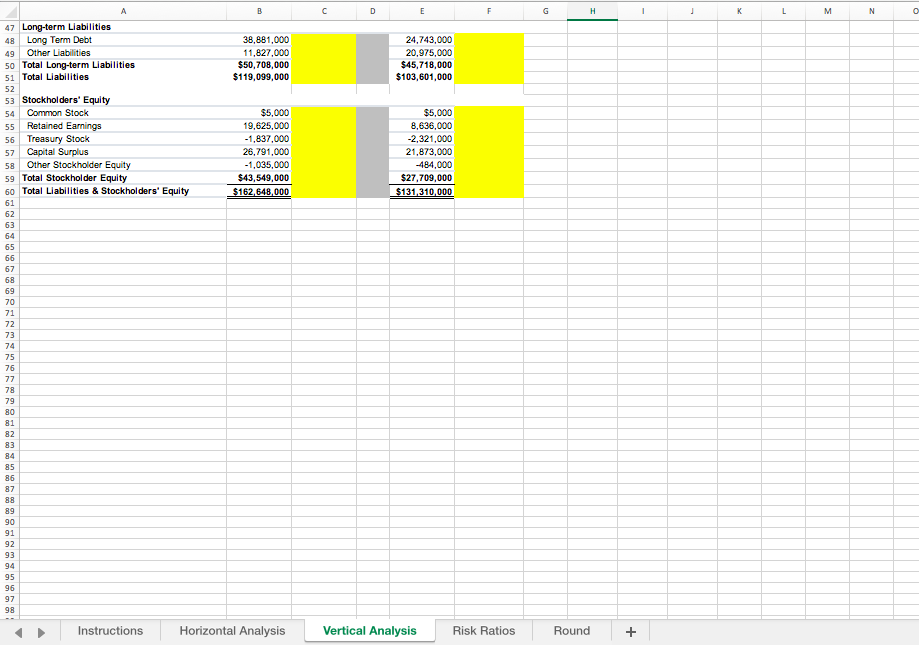
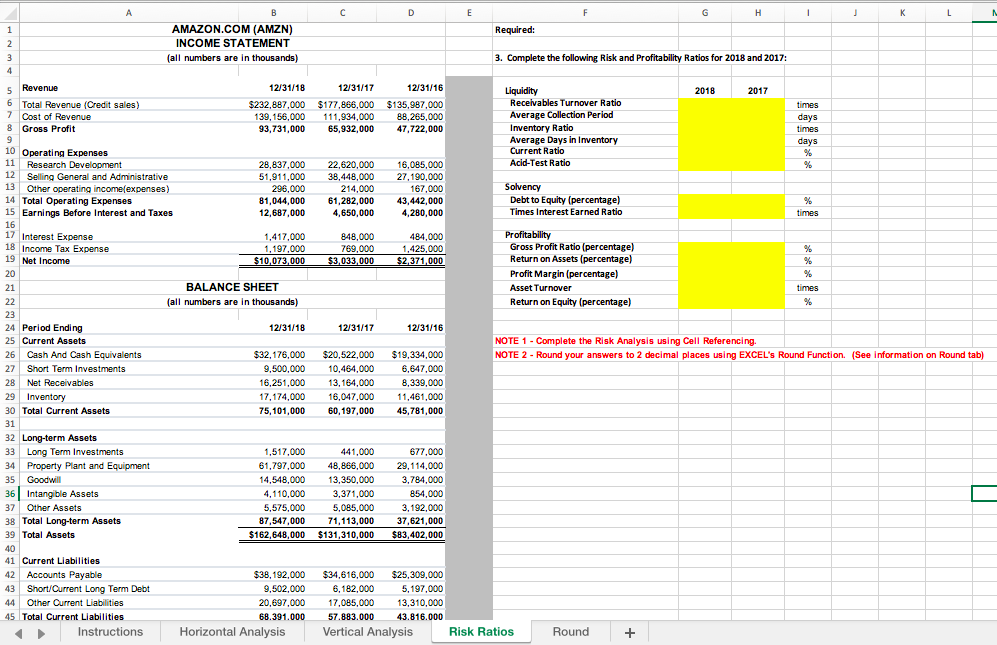
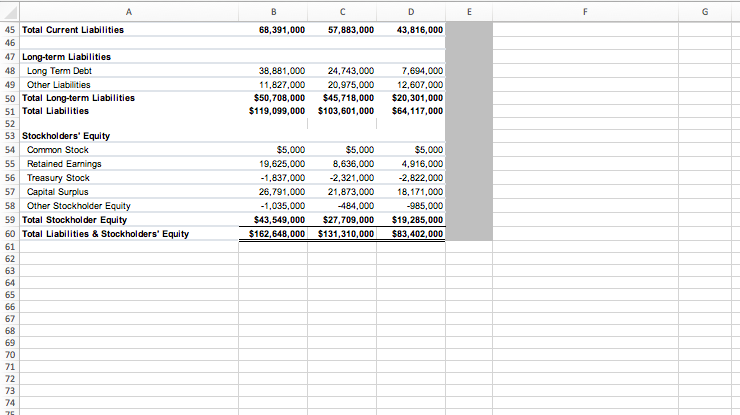
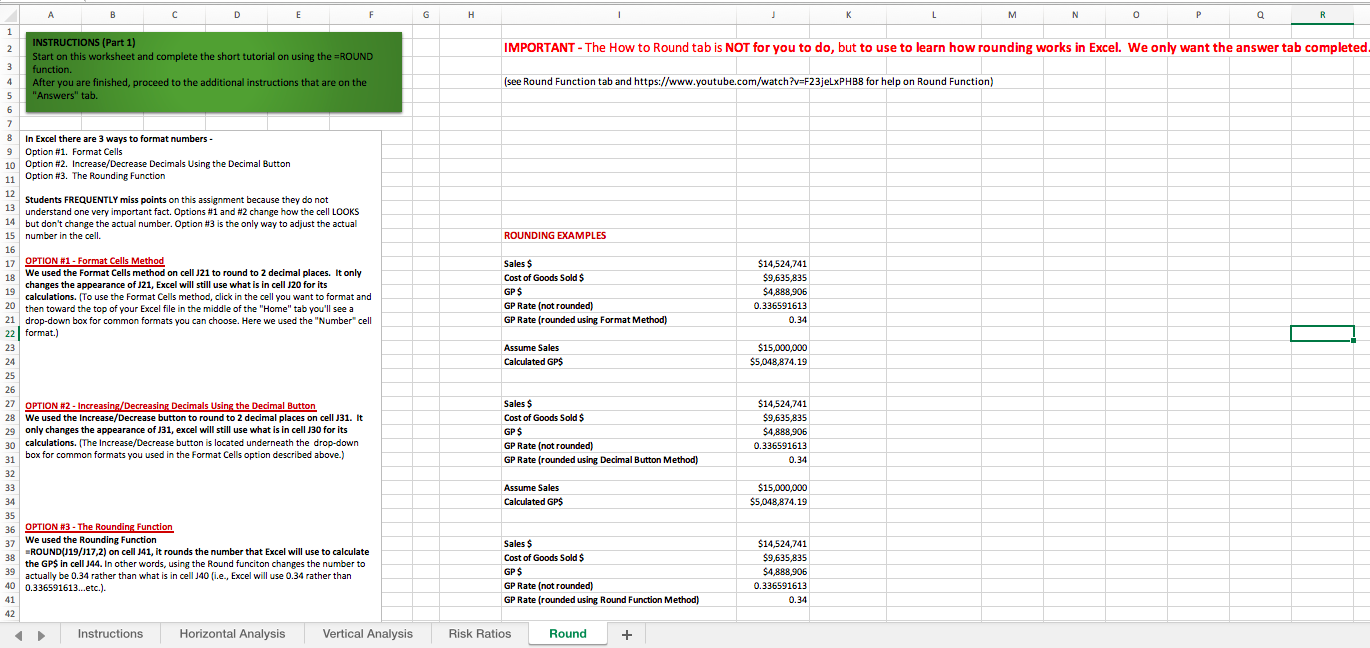
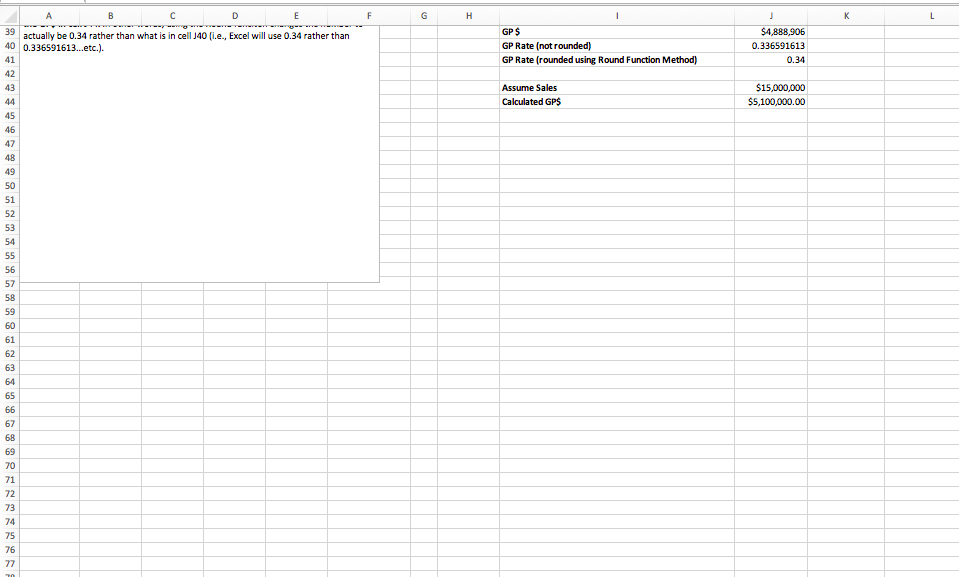
1 2 3 Revenue 5 6 Total Revenue (Credit) 7 Cost of Revenue 8 Gross Profit 10 Operating Expenses B D AMAZON.COM (AMZN) INCOME STATEMENT (all numbers are in thousands) 12/31/18 12/31/17 G H J Required: M N 0 P 1. Prepare a Horizontal Analysis of the Income Statement and Balance Sheet for 2018 and 2017 S T INCREASE/(DECREASE) NOTE 1 - Complete the Horizontal Analysis using Cell Referencing. 12/31/16 AMOUNT AMOUNT NOTE 2 - Round your answers to 1 decimal place using the format cells method. (See information on Round tab) $232,887,000 $177,866,000 $135,987,000 139,156,000 111,934,000 88,265,000 47,722,000 93,731,000 65,932,000 11 Research Development 12 Selling General and Administrative 13 Other operating income(expenses) 14 Total Operating Expenses 15 Earnings Before Interest and Taxes 28,837,000 51,911,000 296,000 81,044,000 12,687,000 22,620,000 16,085,000 38,448,000 27,190,000 214,000 61,282,000 4,650,000 167,000 43,442,000 4,280,000 16 17 Interest Expense 1,417,000 18 Income Tax Expense 19 Net Income 1,197,000 $10,073,000 848,000 769,000 $3,033,000 484,000 1,425,000 $2,371,000 20 21 BALANCE SHEET 22 23 24 Period Ending 25 Current Assets 26 Cash And Cash Equivalents 27 Short Term Investments 28 Net Receivables 29 Inventory 30 Total Current Assets 12/31/18 12/31/17 12/31/16 $32,176,000 9,500,000 $20,522,000 $19,334,000 10,464,000 6,647,000 16,251,000 13,164,000 8,339,000 17,174,000 16,047,000 11,461,000 75,101,000 60,197,000 45,781,000 31 32 Long-term Assets 33 Long Term Investments 1,517,000 34 Property Plant and Equipment 61,797,000 441,000 677,000 48,866,000 29,114,000 35 Goodwill 14,548,000 13,350,000 3,784,000 36 Intangible Assets 4,110,000 3,371,000 854,000 37 Other Assets 5,575,000 5,085,000 3,192,000 38 Total Long-term Assets 87,547,000 71,113,000 37,621,000 39 Total Assets 40 $162,648,000 $131,310,000 $83,402,000 41 Current Liabilities 42 Accounts Payable 43 Short/Current Long Term Debt 44 Other Current Liabilities 45 Total Current Liabilities $38,192,000 9,502,000 20,697,000 68,391,000 $34,616,000 $25,309,000 6,182,000 17,085,000 57,883,000 5,197,000 13,310,000 43,816,000 Instructions Horizontal Analysis Vertical Analysis Risk Ratios Round + 45 Total Current Liabilities 68,391,000 57,883,000 43,816,000 46 47 Long-term Liabilities 48 Long Term Debt 38,881,000 24,743,000 7,694,000 49 Other Liabilities 50 Total Long-term Liabilities $50,708,000 51 Total Liabilities 52 53 Stockholders' Equity $119,099,000 11,827,000 20,975,000 12,607,000 $45,718,000 $20,301,000 $103,601,000 $64,117,000 54 Common Stock 55 Retained Earnings $5,000 19,625,000 56 Treasury Stock -1,837,000 57 Capital Surplus 26,791,000 58 Other Stockholder Equity -1,035,000 59 Total Stockholder Equity $43,549,000 $27,709,000 60 Total Liabilities & Stockholders' Equity $5,000 4,916,000 -2,822,000 18,171,000 -985,000 $19,285,000 $162,648,000 $131,310,000 $83,402,000 $5,000 8,636,000 -2,321,000 21,873,000 -484,000 61 62 63 64 65 66 67 68 69 70 71 72 73 74 75 76 77 Instructions Horizontal Analysis Vertical Analysis Risk Ratios Round + A 1 2 3 4 Revenue 5 6 Total Revenue (Credit) 7 Cost of Revenue 8 Gross Profit 9 10 Operating Expenses AMAZON.COM (AMZN) INCOME STATEMENT (all numbers are in thousands) C D E F G H 1 J K L M N P Q R S Required: 12/31/18 % $232,887,000 139,156,000 93,731,000 12/31/17 $177,866,000 111,934,000 65,932,000 11 Research Development 12 13 Selling General and Administrative Others 28,837,000 22,620,000 51,911,000 38,448,000 296,000 214,000 14 Total Operating Expenses 81,044,000 15 Earnings Before Interest and Taxes 12,687,000 16 17 Interest Expense 18 Income Tax Expense 19 Net Income 20 21 22 23 1,197,000 $10,073,000 BALANCE SHEET 1,417,000 61,282,000 4,650,000 848,000 769,000 $3,033,000 24 Period Ending 25 Current Assets 26 Cash And Cash Equivalents 27 Short Term Investments 28 Net Receivables 29 Inventory 30 Total Current Assets 12/31/18 % 12/31/17 % $32,176,000 $20,522,000 9,500,000 10,464,000 16,251,000 13,164,000 17,174,000 16,047,000 75,101,000 60,197,000 31 32 Long-term Assets 33 Long Term Investments 1,517,000 441,000 34 Property Plant and Equipment 61,797,000 48,866,000 35 Goodwill 14,548,000 13,350,000 36 Intangible Assets 4,110,000 3,371,000 37 Other Assets 5,575,000 5,085,000 38 Total Long-term Assets 87,547,000 71,113,000 39 Total Assets $162,648,000 $131,310,000 40 41 Current Liabilities 42 Accounts Payable $38,192,000 43 Short/Current Long Term Debt 9,502,000 $34,616,000 6,182,000 44 Other Current Liabilities 20,697,000 68,391,000 17,085,000 57,883,000 45 Total Current Liabilities 46 47 Long-term Liabilities 48 Long Term Debt 2. Prepare a Vertical Analysis of the Income Statement and Balance Sheet for 2018 and 2017 NOTE 1 - Complete the Horizontal Analysis using Cell Referencing. NOTE 2 - Round your answers to 1 decimal place using the increase/decrease decimal method. (See information on Round tab) 38,881,000 24,743,000 Instructions Horizontal Analysis Vertical Analysis Risk Ratios Round + A B C D E F G J K L M N 47 Long-term Liabilities 48 Long Term Debt 38,881,000 49 Other Liabilities 11,827,000 50 Total Long-term Liabilities 51 Total Liabilities 52 53 Stockholders' Equity $50,708,000 $119,099,000 24,743,000 20,975,000 $45,718,000 $103,601,000 54 Common Stock 55 Retained Earnings 56 Treasury Stock 57 Capital Surplus 58 Other Stockholder Equity 59 Total Stockholder Equity 60 Total Liabilities & Stockholders' Equity $5,000 $5,000 19,625,000 -1,837,000 8,636,000 -2,321,000 26,791,000 21,873,000 -1,035,000 -484,000 $43,549,000 $162,648,000 $27,709,000 $131,310,000 61 62 63 64 65 66 67 68 69 70 71 72 73 74 75 76 77 78 79 80 81 82 83 84 85 86 87 88 89 90 91 92 93 94 95 96 97 98 Instructions Horizontal Analysis Vertical Analysis Risk Ratios Round + 1 2 3 4 5 Revenue 6 Total Revenue (Credit sales) 7 Cost of Revenue 8 Gross Profit 9 10 Operating Expenses AMAZON.COM (AMZN) INCOME STATEMENT (all numbers are in thousands) 11 12 Research Development Selling General and Administrative 13 Other operating income(expenses) 14 Total Operating Expenses 15 Earnings Before Interest and Taxes 16 17 Interest Expense 18 Income Tax Expense 19 Net Income 20 21 22 23 24 Period Ending 25 Current Assets 26 Cash And Cash Equivalents 27 Short Term Investments 28 Net Receivables 29 Inventory 30 Total Current Assets D E F Required: H J K L 3. Complete the following Risk and Profitability Ratios for 2018 and 2017: Liquidity 12/31/18 12/31/17 12/31/16 $232,887,000 $177,866,000 $135,987,000 Receivables Turnover Ratio 139,156,000 111,934,000 88,265,000 Average Collection Period 93,731,000 65,932,000 47,722,000 Inventory Ratio Average Days in Inventory Current Ratio 28,837,000 51,911,000 296,000 81,044,000 12,687,000 22,620,000 38,448,000 214,000 61,282,000 4,650,000 16,085,000 27,190,000 167,000 43,442,000 4,280,000 1,417,000 1,197,000 $10,073,000 848,000 769,000 $3,033,000 484,000 1,425,000 $2,371,000 Acid-Test Ratio Solvency Debt to Equity (percentage) Times Interest Earned Ratio Profitability Gross Profit Ratio (percentage) Return on Assets (percentage) Profit Margin (percentage) Asset Turnover BALANCE SHEET (all numbers are in thousands) Return on Equity (percentage) 2018 2017 times days times days % % % times % % % times % 12/31/18 12/31/17 12/31/16 NOTE 1 - Complete the Risk Analysis using Cell Referencing. $32,176,000 9,500,000 16,251,000 $20,522,000 $19,334,000 10,464,000 13,164,000 NOTE 2 - Round your answers to 2 decimal places using EXCEL's Round Function. (See information on Round tab) 17,174,000 16,047,000 6,647,000 8,339,000 11,461,000 75,101,000 60,197,000 45,781,000 31 32 Long-term Assets 33 Long Term Investments 1,517,000 441,000 677,000 34 Property Plant and Equipment 61,797,000 48,866,000 29,114,000 35 Goodwill 14,548,000 13,350,000 3,784,000 36 Intangible Assets 4,110,000 3,371,000 854,000 37 Other Assets 5,575,000 5,085,000 3,192,000 38 Total Long-term Assets 87,547,000 71,113,000 37,621,000 $162,648,000 $131,310,000 $83,402,000 39 Total Assets 40 41 Current Liabilities 42 Accounts Payable 43 Short/Current Long Term Debt 44 Other Current Liabilities 45 Total Current Liabilities Instructions $38,192,000 $34,616,000 $25,309,000 9,502,000 6,182,000 5,197,000 20,697,000 68.391.000 17,085,000 57.883.000 13,310,000 43.816.000 Horizontal Analysis Vertical Analysis Risk Ratios Round + 45 Total Current Liabilities 46 47 Long-term Liabilities 48 Long Term Debt A B 68,391,000 49 Other Liabilities 50 Total Long-term Liabilities 51 Total Liabilities 52 53 Stockholders' Equity 54 Common Stock 55 Retained Earnings 56 Treasury Stock 57 Capital Surplus 58 Other Stockholder Equity 59 Total Stockholder Equity 60 Total Liabilities & Stockholders' Equity 61 62 63 64 65 66 67 68 69 70 71 72 73 74 75 C D E F G 57,883,000 43,816,000 38,881,000 11,827,000 24,743,000 7,694,000 20,975,000 12,607,000 $50,708,000 $45,718,000 $20,301,000 $119,099,000 $103,601,000 $64,117,000 $5,000 19,625,000 $5,000 $5,000 8,636,000 4,916,000 -1,837,000 26,791,000 21,873,000 -2,321,000 -2,822,000 18,171,000 -1,035,000 -484,000 -985,000 $43,549,000 $27,709,000 $19,285,000 $162,648,000 $131,310,000 $83,402,000 A B D E F G 1 2 3 INSTRUCTIONS (Part 1) Start on this worksheet and complete the short tutorial on using the =ROUND function. 4 After you are finished, proceed to the additional instructions that are on the 5 "Answers" tab. 7 8 In Excel there are 3 ways to format numbers - 9 Option #1. Format Cells 10 Option #2. Increase/Decrease Decimals Using the Decimal Button 11 Option #3. The Rounding Function 12 Students FREQUENTLY miss points on this assignment because they do not 1 J L M N 0 P R IMPORTANT - The How to Round tab is NOT for you to do, but to use to learn how rounding works in Excel. We only want the answer tab completed. (see Round Function tab and https://www.youtube.com/watch?v=F23jeLxPHB8 for help on Round Function) 13 understand one very important fact. Options #1 and #2 change how the cell LOOKS 14 but don't change the actual number. Option #3 is the only way to adjust the actual 15 number in the cell. 16 17 OPTION #1 - Format Cells Method 18 19 We used the Format Cells method on cell J21 to round to 2 decimal places. It only changes the appearance of J21, Excel will still use what is in cell J20 for its calculations. (To use the Format Cells method, click in the cell you want to format and 20 then toward the top of your Excel file in the middle of the "Home" tab you'll see a 21 drop-down box for common formats you can choose. Here we used the "Number" cell 22 format.) ROUNDING EXAMPLES Sales $ Cost of Goods Sold $ GP $ GP Rate (not rounded) GP Rate (rounded using Format Method) Assume Sales 24 25 26 27 OPTION #2 - Increasing/Decreasing Decimals Using the Decimal Button 28 We used the Increase/Decrease button to round to 2 decimal places on cell J31. It 29 only changes the appearance of J31, excel will still use what is in cell J30 for its 30 calculations. (The Increase/Decrease button is located underneath the drop-down 31 box for common formats you used in the Format Cells option described above.) 32 33 34 35 36 OPTION #3 - The Rounding Function 37 38 We used the Rounding Function =ROUND(J19/J17,2) on cell J41, it rounds the number that Excel will use to calculate the GPS in cell J44. In other words, using the Round funciton changes the number to actually be 0.34 rather than what is in cell J40 (i.e., Excel will use 0.34 rather than 40 0.336591613...etc.). 41 42 Calculated GPS $14,524,741 $9,635,835 $4,888,906 0.336591613 0.34 $15,000,000 $5,048,874.19 Sales $ Cost of Goods Sold $ GP $ GP Rate (not rounded) GP Rate (rounded using Decimal Button Method) Assume Sales Calculated GPS $14,524,741 $9,635,835 $4,888,906 0.336591613 0.34 $15,000,000 $5,048,874.19 Sales $ Cost of Goods Sold $ GP $ GP Rate (not rounded) GP Rate (rounded using Round Function Method) Instructions Horizontal Analysis Vertical Analysis Risk Ratios Round + $14,524,741 $9,635,835 $4,888,906 0.336591613 0.34 A B C D E F G 39 actually be 0.34 rather than what is in cell J40 (i.e., Excel will use 0.34 rather than 40 0.336591613...etc.). 41 48 49 50 51 52 53 54 55 56 57 58 59 60 61 62 64 65 67 68 69 70 71 72 73 74 75 76 77 GENE 4 4 4 4 2 636363 REFERRE 42 43 44 45 46 47 J K L GP $ $4,888,906 GP Rate (not rounded) 0.336591613 GP Rate (rounded using Round Function Method) 0.34 Assume Sales $15,000,000 Calculated GP$ $5,100,000.00 1 2 3 Revenue 5 6 Total Revenue (Credit) 7 Cost of Revenue 8 Gross Profit 10 Operating Expenses B D AMAZON.COM (AMZN) INCOME STATEMENT (all numbers are in thousands) 12/31/18 12/31/17 G H J Required: M N 0 P 1. Prepare a Horizontal Analysis of the Income Statement and Balance Sheet for 2018 and 2017 S T INCREASE/(DECREASE) NOTE 1 - Complete the Horizontal Analysis using Cell Referencing. 12/31/16 AMOUNT AMOUNT NOTE 2 - Round your answers to 1 decimal place using the format cells method. (See information on Round tab) $232,887,000 $177,866,000 $135,987,000 139,156,000 111,934,000 88,265,000 47,722,000 93,731,000 65,932,000 11 Research Development 12 Selling General and Administrative 13 Other operating income(expenses) 14 Total Operating Expenses 15 Earnings Before Interest and Taxes 28,837,000 51,911,000 296,000 81,044,000 12,687,000 22,620,000 16,085,000 38,448,000 27,190,000 214,000 61,282,000 4,650,000 167,000 43,442,000 4,280,000 16 17 Interest Expense 1,417,000 18 Income Tax Expense 19 Net Income 1,197,000 $10,073,000 848,000 769,000 $3,033,000 484,000 1,425,000 $2,371,000 20 21 BALANCE SHEET 22 23 24 Period Ending 25 Current Assets 26 Cash And Cash Equivalents 27 Short Term Investments 28 Net Receivables 29 Inventory 30 Total Current Assets 12/31/18 12/31/17 12/31/16 $32,176,000 9,500,000 $20,522,000 $19,334,000 10,464,000 6,647,000 16,251,000 13,164,000 8,339,000 17,174,000 16,047,000 11,461,000 75,101,000 60,197,000 45,781,000 31 32 Long-term Assets 33 Long Term Investments 1,517,000 34 Property Plant and Equipment 61,797,000 441,000 677,000 48,866,000 29,114,000 35 Goodwill 14,548,000 13,350,000 3,784,000 36 Intangible Assets 4,110,000 3,371,000 854,000 37 Other Assets 5,575,000 5,085,000 3,192,000 38 Total Long-term Assets 87,547,000 71,113,000 37,621,000 39 Total Assets 40 $162,648,000 $131,310,000 $83,402,000 41 Current Liabilities 42 Accounts Payable 43 Short/Current Long Term Debt 44 Other Current Liabilities 45 Total Current Liabilities $38,192,000 9,502,000 20,697,000 68,391,000 $34,616,000 $25,309,000 6,182,000 17,085,000 57,883,000 5,197,000 13,310,000 43,816,000 Instructions Horizontal Analysis Vertical Analysis Risk Ratios Round + 45 Total Current Liabilities 68,391,000 57,883,000 43,816,000 46 47 Long-term Liabilities 48 Long Term Debt 38,881,000 24,743,000 7,694,000 49 Other Liabilities 50 Total Long-term Liabilities $50,708,000 51 Total Liabilities 52 53 Stockholders' Equity $119,099,000 11,827,000 20,975,000 12,607,000 $45,718,000 $20,301,000 $103,601,000 $64,117,000 54 Common Stock 55 Retained Earnings $5,000 19,625,000 56 Treasury Stock -1,837,000 57 Capital Surplus 26,791,000 58 Other Stockholder Equity -1,035,000 59 Total Stockholder Equity $43,549,000 $27,709,000 60 Total Liabilities & Stockholders' Equity $5,000 4,916,000 -2,822,000 18,171,000 -985,000 $19,285,000 $162,648,000 $131,310,000 $83,402,000 $5,000 8,636,000 -2,321,000 21,873,000 -484,000 61 62 63 64 65 66 67 68 69 70 71 72 73 74 75 76 77 Instructions Horizontal Analysis Vertical Analysis Risk Ratios Round + A 1 2 3 4 Revenue 5 6 Total Revenue (Credit) 7 Cost of Revenue 8 Gross Profit 9 10 Operating Expenses AMAZON.COM (AMZN) INCOME STATEMENT (all numbers are in thousands) C D E F G H 1 J K L M N P Q R S Required: 12/31/18 % $232,887,000 139,156,000 93,731,000 12/31/17 $177,866,000 111,934,000 65,932,000 11 Research Development 12 13 Selling General and Administrative Others 28,837,000 22,620,000 51,911,000 38,448,000 296,000 214,000 14 Total Operating Expenses 81,044,000 15 Earnings Before Interest and Taxes 12,687,000 16 17 Interest Expense 18 Income Tax Expense 19 Net Income 20 21 22 23 1,197,000 $10,073,000 BALANCE SHEET 1,417,000 61,282,000 4,650,000 848,000 769,000 $3,033,000 24 Period Ending 25 Current Assets 26 Cash And Cash Equivalents 27 Short Term Investments 28 Net Receivables 29 Inventory 30 Total Current Assets 12/31/18 % 12/31/17 % $32,176,000 $20,522,000 9,500,000 10,464,000 16,251,000 13,164,000 17,174,000 16,047,000 75,101,000 60,197,000 31 32 Long-term Assets 33 Long Term Investments 1,517,000 441,000 34 Property Plant and Equipment 61,797,000 48,866,000 35 Goodwill 14,548,000 13,350,000 36 Intangible Assets 4,110,000 3,371,000 37 Other Assets 5,575,000 5,085,000 38 Total Long-term Assets 87,547,000 71,113,000 39 Total Assets $162,648,000 $131,310,000 40 41 Current Liabilities 42 Accounts Payable $38,192,000 43 Short/Current Long Term Debt 9,502,000 $34,616,000 6,182,000 44 Other Current Liabilities 20,697,000 68,391,000 17,085,000 57,883,000 45 Total Current Liabilities 46 47 Long-term Liabilities 48 Long Term Debt 2. Prepare a Vertical Analysis of the Income Statement and Balance Sheet for 2018 and 2017 NOTE 1 - Complete the Horizontal Analysis using Cell Referencing. NOTE 2 - Round your answers to 1 decimal place using the increase/decrease decimal method. (See information on Round tab) 38,881,000 24,743,000 Instructions Horizontal Analysis Vertical Analysis Risk Ratios Round + A B C D E F G J K L M N 47 Long-term Liabilities 48 Long Term Debt 38,881,000 49 Other Liabilities 11,827,000 50 Total Long-term Liabilities 51 Total Liabilities 52 53 Stockholders' Equity $50,708,000 $119,099,000 24,743,000 20,975,000 $45,718,000 $103,601,000 54 Common Stock 55 Retained Earnings 56 Treasury Stock 57 Capital Surplus 58 Other Stockholder Equity 59 Total Stockholder Equity 60 Total Liabilities & Stockholders' Equity $5,000 $5,000 19,625,000 -1,837,000 8,636,000 -2,321,000 26,791,000 21,873,000 -1,035,000 -484,000 $43,549,000 $162,648,000 $27,709,000 $131,310,000 61 62 63 64 65 66 67 68 69 70 71 72 73 74 75 76 77 78 79 80 81 82 83 84 85 86 87 88 89 90 91 92 93 94 95 96 97 98 Instructions Horizontal Analysis Vertical Analysis Risk Ratios Round + 1 2 3 4 5 Revenue 6 Total Revenue (Credit sales) 7 Cost of Revenue 8 Gross Profit 9 10 Operating Expenses AMAZON.COM (AMZN) INCOME STATEMENT (all numbers are in thousands) 11 12 Research Development Selling General and Administrative 13 Other operating income(expenses) 14 Total Operating Expenses 15 Earnings Before Interest and Taxes 16 17 Interest Expense 18 Income Tax Expense 19 Net Income 20 21 22 23 24 Period Ending 25 Current Assets 26 Cash And Cash Equivalents 27 Short Term Investments 28 Net Receivables 29 Inventory 30 Total Current Assets D E F Required: H J K L 3. Complete the following Risk and Profitability Ratios for 2018 and 2017: Liquidity 12/31/18 12/31/17 12/31/16 $232,887,000 $177,866,000 $135,987,000 Receivables Turnover Ratio 139,156,000 111,934,000 88,265,000 Average Collection Period 93,731,000 65,932,000 47,722,000 Inventory Ratio Average Days in Inventory Current Ratio 28,837,000 51,911,000 296,000 81,044,000 12,687,000 22,620,000 38,448,000 214,000 61,282,000 4,650,000 16,085,000 27,190,000 167,000 43,442,000 4,280,000 1,417,000 1,197,000 $10,073,000 848,000 769,000 $3,033,000 484,000 1,425,000 $2,371,000 Acid-Test Ratio Solvency Debt to Equity (percentage) Times Interest Earned Ratio Profitability Gross Profit Ratio (percentage) Return on Assets (percentage) Profit Margin (percentage) Asset Turnover BALANCE SHEET (all numbers are in thousands) Return on Equity (percentage) 2018 2017 times days times days % % % times % % % times % 12/31/18 12/31/17 12/31/16 NOTE 1 - Complete the Risk Analysis using Cell Referencing. $32,176,000 9,500,000 16,251,000 $20,522,000 $19,334,000 10,464,000 13,164,000 NOTE 2 - Round your answers to 2 decimal places using EXCEL's Round Function. (See information on Round tab) 17,174,000 16,047,000 6,647,000 8,339,000 11,461,000 75,101,000 60,197,000 45,781,000 31 32 Long-term Assets 33 Long Term Investments 1,517,000 441,000 677,000 34 Property Plant and Equipment 61,797,000 48,866,000 29,114,000 35 Goodwill 14,548,000 13,350,000 3,784,000 36 Intangible Assets 4,110,000 3,371,000 854,000 37 Other Assets 5,575,000 5,085,000 3,192,000 38 Total Long-term Assets 87,547,000 71,113,000 37,621,000 $162,648,000 $131,310,000 $83,402,000 39 Total Assets 40 41 Current Liabilities 42 Accounts Payable 43 Short/Current Long Term Debt 44 Other Current Liabilities 45 Total Current Liabilities Instructions $38,192,000 $34,616,000 $25,309,000 9,502,000 6,182,000 5,197,000 20,697,000 68.391.000 17,085,000 57.883.000 13,310,000 43.816.000 Horizontal Analysis Vertical Analysis Risk Ratios Round + 45 Total Current Liabilities 46 47 Long-term Liabilities 48 Long Term Debt A B 68,391,000 49 Other Liabilities 50 Total Long-term Liabilities 51 Total Liabilities 52 53 Stockholders' Equity 54 Common Stock 55 Retained Earnings 56 Treasury Stock 57 Capital Surplus 58 Other Stockholder Equity 59 Total Stockholder Equity 60 Total Liabilities & Stockholders' Equity 61 62 63 64 65 66 67 68 69 70 71 72 73 74 75 C D E F G 57,883,000 43,816,000 38,881,000 11,827,000 24,743,000 7,694,000 20,975,000 12,607,000 $50,708,000 $45,718,000 $20,301,000 $119,099,000 $103,601,000 $64,117,000 $5,000 19,625,000 $5,000 $5,000 8,636,000 4,916,000 -1,837,000 26,791,000 21,873,000 -2,321,000 -2,822,000 18,171,000 -1,035,000 -484,000 -985,000 $43,549,000 $27,709,000 $19,285,000 $162,648,000 $131,310,000 $83,402,000 A B D E F G 1 2 3 INSTRUCTIONS (Part 1) Start on this worksheet and complete the short tutorial on using the =ROUND function. 4 After you are finished, proceed to the additional instructions that are on the 5 "Answers" tab. 7 8 In Excel there are 3 ways to format numbers - 9 Option #1. Format Cells 10 Option #2. Increase/Decrease Decimals Using the Decimal Button 11 Option #3. The Rounding Function 12 Students FREQUENTLY miss points on this assignment because they do not 1 J L M N 0 P R IMPORTANT - The How to Round tab is NOT for you to do, but to use to learn how rounding works in Excel. We only want the answer tab completed. (see Round Function tab and https://www.youtube.com/watch?v=F23jeLxPHB8 for help on Round Function) 13 understand one very important fact. Options #1 and #2 change how the cell LOOKS 14 but don't change the actual number. Option #3 is the only way to adjust the actual 15 number in the cell. 16 17 OPTION #1 - Format Cells Method 18 19 We used the Format Cells method on cell J21 to round to 2 decimal places. It only changes the appearance of J21, Excel will still use what is in cell J20 for its calculations. (To use the Format Cells method, click in the cell you want to format and 20 then toward the top of your Excel file in the middle of the "Home" tab you'll see a 21 drop-down box for common formats you can choose. Here we used the "Number" cell 22 format.) ROUNDING EXAMPLES Sales $ Cost of Goods Sold $ GP $ GP Rate (not rounded) GP Rate (rounded using Format Method) Assume Sales 24 25 26 27 OPTION #2 - Increasing/Decreasing Decimals Using the Decimal Button 28 We used the Increase/Decrease button to round to 2 decimal places on cell J31. It 29 only changes the appearance of J31, excel will still use what is in cell J30 for its 30 calculations. (The Increase/Decrease button is located underneath the drop-down 31 box for common formats you used in the Format Cells option described above.) 32 33 34 35 36 OPTION #3 - The Rounding Function 37 38 We used the Rounding Function =ROUND(J19/J17,2) on cell J41, it rounds the number that Excel will use to calculate the GPS in cell J44. In other words, using the Round funciton changes the number to actually be 0.34 rather than what is in cell J40 (i.e., Excel will use 0.34 rather than 40 0.336591613...etc.). 41 42 Calculated GPS $14,524,741 $9,635,835 $4,888,906 0.336591613 0.34 $15,000,000 $5,048,874.19 Sales $ Cost of Goods Sold $ GP $ GP Rate (not rounded) GP Rate (rounded using Decimal Button Method) Assume Sales Calculated GPS $14,524,741 $9,635,835 $4,888,906 0.336591613 0.34 $15,000,000 $5,048,874.19 Sales $ Cost of Goods Sold $ GP $ GP Rate (not rounded) GP Rate (rounded using Round Function Method) Instructions Horizontal Analysis Vertical Analysis Risk Ratios Round + $14,524,741 $9,635,835 $4,888,906 0.336591613 0.34 A B C D E F G 39 actually be 0.34 rather than what is in cell J40 (i.e., Excel will use 0.34 rather than 40 0.336591613...etc.). 41 48 49 50 51 52 53 54 55 56 57 58 59 60 61 62 64 65 67 68 69 70 71 72 73 74 75 76 77 GENE 4 4 4 4 2 636363 REFERRE 42 43 44 45 46 47 J K L GP $ $4,888,906 GP Rate (not rounded) 0.336591613 GP Rate (rounded using Round Function Method) 0.34 Assume Sales $15,000,000 Calculated GP$ $5,100,000.00
Expert Answer:

Related Book For 

Income Tax Fundamentals 2013
ISBN: 9781285586618
31st Edition
Authors: Gerald E. Whittenburg, Martha Altus Buller, Steven L Gill
Posted Date:
Students also viewed these accounting questions
-
Let R denote the set of continuous functions with domain R (as in calculus). Then R is a commutative ring with identity. The additive identity OR is the zero function (that is, the function h(x)...
-
Jyvaskyla Oy is a retail chain of supermarkets. For many years, it has used gross margin (selling price minus cost of goods sold) to guide it in deciding on which products to emphasis or de-emphasis....
-
The comparative statements of financial position for Amaral Reis SA as of December 31 are presented as follows. Additional information: 1. Operating expenses include depreciation expense of R$40,000....
-
The John Gore Organization owns and operates the Charles Playhouse, a theater in Boston, Massachusetts. Evelyn Castillo has diabetes, a disability under the Americans with Disabilities Act (ADA)....
-
Seles Corporations charter authorized issuance of 100,000 shares of $10 par value common stock and 50,000 shares of $50 preferred stock. The following transactions involving the issuance of shares of...
-
The population of a colony of bacteria grows according the formula P(t) = 4(1.40) 24 where: P represents the population t represents time in hours How long, to the nearest hour, does it take the...
-
Which is shorter: a 95% z -interval or b 95% t -interval for if we know that =s?
-
How social problems of vulnerable populations have perpetuated or are affected by poverty on a micro and macro level.
-
Exar Document Specialist is a service firm specialising in document preparation. Their office consists of 14 units with 5 employees to each unit. Each document specialist is equipped with a word...
-
What are some biases, stereotypes, preconceptions and or assumptions about clients which you specifically need to be aware of? what are some areas for improvement? What do you intend on doing to...
-
Using the above video, why are the perspectives on the interview so different, and were they fair? Explain. Why would or wouldn't someone offer Felix the position? Explain. What are the 2 insights...
-
Define both of concepts active and passive audiences. no copy and paste from the website, I need original sentences of the definition.
-
A wind turbine is initially spinning at a constant angular speed. As the wind's strength gradually increases, the turbine experiences a constant angular acceleration of 0.170 rad/s2. After making...
-
In a paragraph of approximately 150-200 words, analyze a film or TV/Streaming Show poster of your choosing by focusing on the ways in which representations in the poster are gendered. Include an...
-
David and Darlene Jasper have one child, Sam, who is 6 years old. The Jaspers reside at 4639 Honeysuckle Lane, Los Angeles, CA 90248. David's Social Security number is 577-11-3311, Darlene's is...
-
Patty Bayan is a single taxpayer living at 543 Space Drive, Houston, TX 77099. Her Social Security number is 466-33-1234. For 2012, Patty has no dependents, and her W-2 from her job at a local...
-
In 2012, Michael has net short-term capital losses of $2,000, a net long-term capital loss of $45,000, and other ordinary taxable income of $45,000. a. Calculate the amount of Michael's deduction for...
-
Water is to be cooled at the rate of \(10 \mathrm{~kg} / \mathrm{s}\) from \(317 \mathrm{~K}\) to \(300 \mathrm{~K}\) in a countercurrent cooling tower under conditions such that \(H_{t O G}=2.5...
-
In a plant for the recovery of acetone which has been used as a solvent, the acetone is evaporated into a stream of nitrogen gas. A mixture of acetone vapor and nitrogen flows through a duct, 0.3 by...
-
In the cooling tower of Example 8.7, to what temperature would the water be cooled if, after the tower was built and operated at the design water and air rates, the air entered at a dry-bulb...

Study smarter with the SolutionInn App