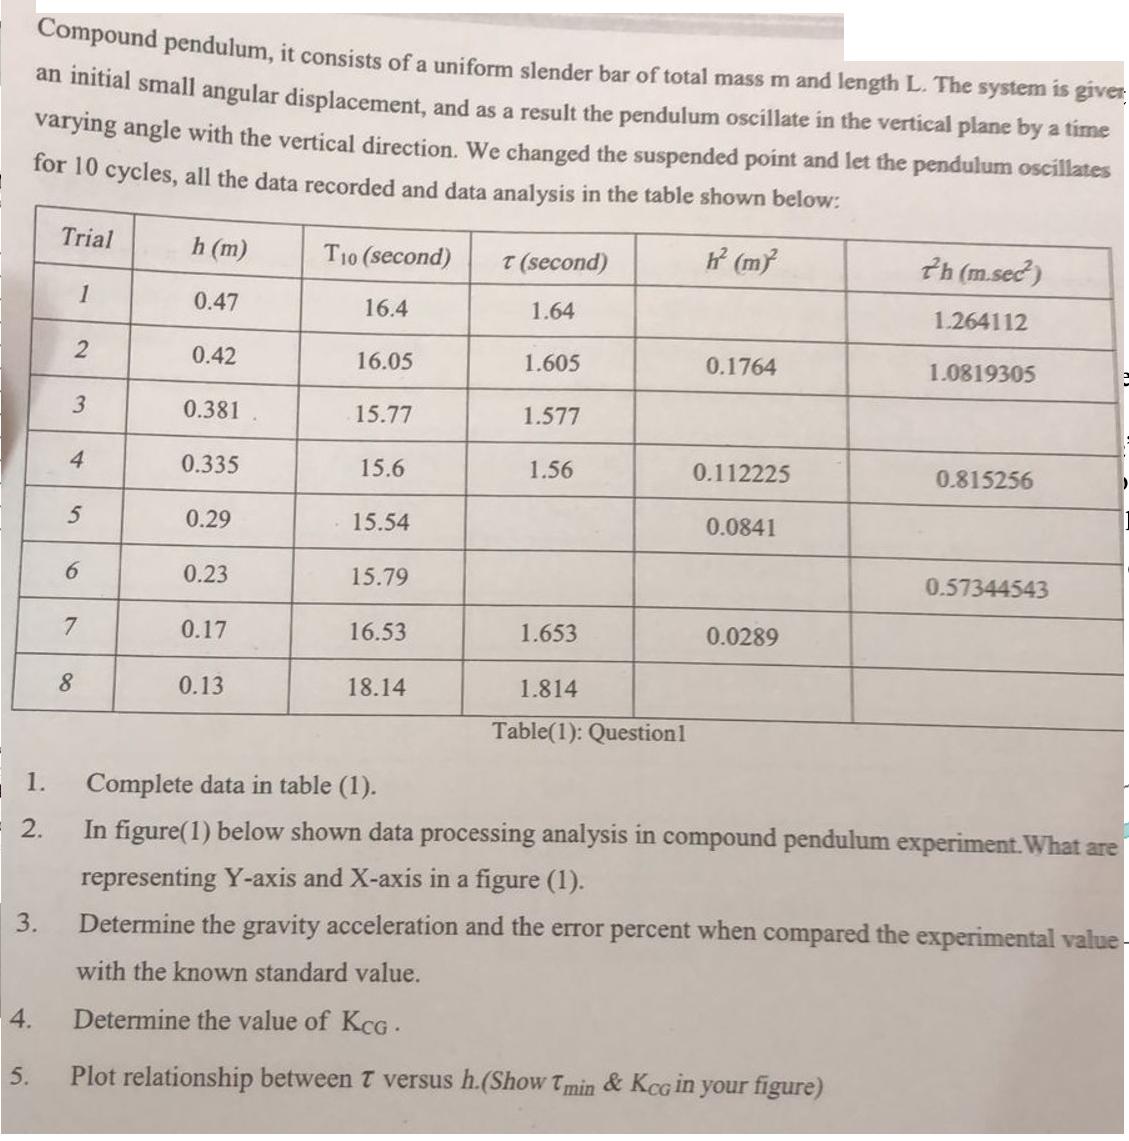
1. 2. Compound pendulum, it consists of a uniform slender bar of total mass m and...
Fantastic news! We've Found the answer you've been seeking!
Question:
Transcribed Image Text:
1. 2. Compound pendulum, it consists of a uniform slender bar of total mass m and length L. The system is giver an initial small angular displacement, and as a result the pendulum oscillate in the vertical plane by a time varying angle with the vertical direction. We changed the suspended point and let the pendulum oscillates for 10 cycles, all the data recorded and data analysis in the table shown below: (m) 3. 4. 5. Trial 2 1 3 4 5 6 7 8 h (m) 0.47 0.42 0.381 0.335 0.29 0.23 0.17 0.13 T10 (second) 16.4 16.05 15.77 15.6 15.54 15.79 16.53 18.14 T (second) 1.64 1.605 1.577 1.56 1.653 1.814 Table(1): Questionl 0.1764 0.112225 0.0841 0.0289 th (m.sec) 1.264112 1.0819305 0.815256 0.57344543 ) Complete data in table (1). In figure(1) below shown data processing analysis in compound pendulum experiment. What are representing Y-axis and X-axis in a figure (1). Determine the gravity acceleration and the error percent when compared the experimental value- with the known standard value. Determine the value of KCG. Plot relationship between T versus h.(Show Tmin & KCG in your figure) 1. 2. Compound pendulum, it consists of a uniform slender bar of total mass m and length L. The system is giver an initial small angular displacement, and as a result the pendulum oscillate in the vertical plane by a time varying angle with the vertical direction. We changed the suspended point and let the pendulum oscillates for 10 cycles, all the data recorded and data analysis in the table shown below: (m) 3. 4. 5. Trial 2 1 3 4 5 6 7 8 h (m) 0.47 0.42 0.381 0.335 0.29 0.23 0.17 0.13 T10 (second) 16.4 16.05 15.77 15.6 15.54 15.79 16.53 18.14 T (second) 1.64 1.605 1.577 1.56 1.653 1.814 Table(1): Questionl 0.1764 0.112225 0.0841 0.0289 th (m.sec) 1.264112 1.0819305 0.815256 0.57344543 ) Complete data in table (1). In figure(1) below shown data processing analysis in compound pendulum experiment. What are representing Y-axis and X-axis in a figure (1). Determine the gravity acceleration and the error percent when compared the experimental value- with the known standard value. Determine the value of KCG. Plot relationship between T versus h.(Show Tmin & KCG in your figure)
Expert Answer:
Related Book For
Engineering Mechanics Dynamics
ISBN: 9781118885840
8th Edition
Authors: James L. Meriam, L. G. Kraige, J. N. Bolton
Posted Date:
Students also viewed these accounting questions
-
The following additional information is available for the Dr. Ivan and Irene Incisor family from Chapters 1-5. Ivan's grandfather died and left a portfolio of municipal bonds. In 2012, they pay Ivan...
-
A rope of total mass m and length L is suspended vertically. Show that a transverse pulse travels the length of the rope in a time interval t = 2Lig. (Suggestion: First find an expression for the...
-
After researching Best Buy common stock, Sally Jackson is convinced the stock is overpriced. She contacts her account executive and arranges to sell short 200 shares of Best Buy. At the time of the...
-
List by account classification the order of the accounts in the general ledger.
-
Exposure to high concentration of gaseous ammonia can cause lung damage. The acceptable shortterm ammonia exposure level set by the Occupational Safety and Health Administration (OSHA) is 35 ppm for...
-
The Wide World of Fluids article titled "Ice Engineering,". A model study is to be developed to determine the force exerted on bridge piers due to floating chunks of ice in a river. The piers of...
-
Fleetwood Corporation sold $800,000 of 12 percent, 10-year bonds at face value on September 1, 2014. The issue date of the bonds was May 1, 2014. 1. Prepare the journal entries to record the sale of...
-
The following is a sequence of eight numbers: 01 2 3 4 5 6 7 350 100 250 400 300 50 200 150 Use QuickSort to sort the numbers in the sequence in ascending order. Show the result of each step by...
-
Find the area under the standard normal distribution curve between z=0.18 and z=-0.38. Use Table E and enter the answer to 4 decimal places. The area between the two z values is
-
An electron in an x-ray machine is accelerated through a potential difference of 1.00 x 10⁴ V before it hits the target. What is the kinetic energy of the electron in electron volts?
-
There are six cybercrime categories indicated in the lecture, as indicated by Maras (2016a). For this discussion forum, you will examine whether certain types of cybercrime are more common than...
-
The data extracted from Mr. and Mrs. Trudeau's ABSF questionnaire are: Expenses following the death of one or the other are estimated at $5,000. The subsequent tax on the death of one or the other is...
-
In 2022, you had a very strong sales performance. As the Sales Representative for the San Diego territory you achieved a strong sales year (specifics below), as well as assumed a strong base salary...
-
What technique(s) would you use to employ a PFAS with a 6 foot shock absorbing lanyard with 3.5 foot deceleration distance, for a work that was around 6 foot tall, if the distance to the lower...
-
Middleton Associates is a consulting firm that specializes in information systems for construction and landscaping companies. The firm has two offices-one in Toronto and one in Vancouver. The firm...
-
31. What is the income that can be received over 15 years from $500,000 earning 6% annually? 32. What is the semiannual payment required to retire $50,000 in debt over 5 years at 8% compounded...
-
The total linear momentum of a system of five particles at time t = 2.2 s is given by G 2.2 = 3.4i 2.6j + 4.6k kgm/s. At time t = 2.4 s, the linear momentum has changed to G 2.4 = 3.7i 2.2j + 4.9k...
-
The uniform steel I-beam has a mass of 300 kg and is supported in the vertical plane as shown. Calculate the force R supported by the pin at O for the condition immediately after the support at B is...
-
Calculate the moment of inertia of the solid steel semicylinder about the x-x axis and about the parallel x 0 -x 0 axis. (See Table D/1 for the density of steel.) 100 mm Ox 60 mm 60 mm
-
What would be the most effective option to increase employee motivation to stay and reduce the driver turnover rate? Why do you believe this option will be effective?
-
How else might the manager have handled the situation to prevent potential issues, including a negative impact on the teams performance?
-
In what ways do you believe providing special work arrangements or accommodations for employees impacts employee motivation? How does it help? How does it hurt?
Study smarter with the SolutionInn App