

1 2 Milestone Three - Statement of Cost of Goods Sold 3 4 6 Beginning Work...
Fantastic news! We've Found the answer you've been seeking!
Question:
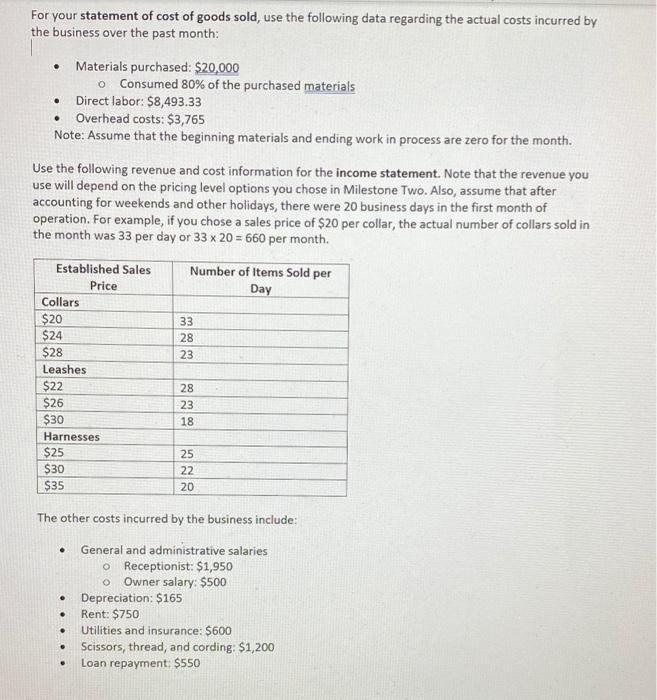
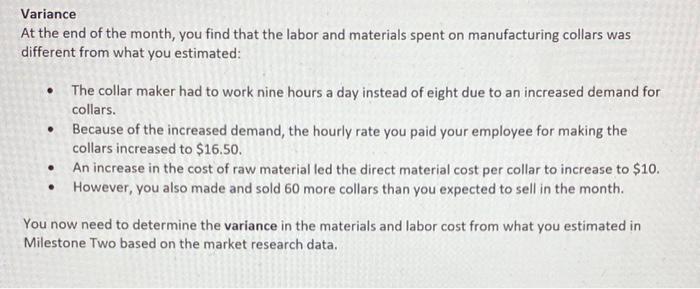
Transcribed Image Text:
1 2 Milestone Three - Statement of Cost of Goods Sold 3 4 6 Beginning Work in Process Inventory 7 Direct Materials: 8 9 11 12 A Materials: Beginning Add: Purchases for month of January 14 15 16 Direct Labor 17 Overhead 24 25 26 Materials available for use Deduct: Ending materials Materials Used 19 Total Costs 20 21 Deduct: Ending Work in Process Inventory 22 23 Cost of Goods Sold 565 B CASTAM 0 C 0 III D 2 Milestone Three - Income Statement 3 4 5 6 7 8 9 10 Total Revenue: 11 Cost of goods sold 12 Gross profit 13. 222 Revenue: 14 Expenses: 15 16 17 18 19 21 Collars Leashes Harnesses 222 20 Loan General and administrative salaries Depreciation 22 Total Expenses 23 27 29 30 31 32 A Rent Utilities and insurance Scissors, thread, and cording 24 Net Income/Loss $ $ B S $ S $ 1 2 Milestone Three - Variance Analysis 3 4 5 Data for Variance Analysis: 6789 8 Labor 10 11 Materials. 0123 A 12 13 14 15 Variances for Collar Sales B 28 29 30 Budgeted (Standard) Hours/Qty 16 17 Direct Labor Time Variance 18 19 20 Direct Labor Rate Variance 21 22 23 Direct Materials Quantity/Efficiency Variance 24 25 26 Direct Materials Price Variance 27 (Actual Hours - Standard Hours) x Standard Rate (Actual Rate - Standard Rate) x Actual Hours Budgeted (Standard) Rate (Actual Quantity - Standard Quantity) x Standard Price (Actual Price - Standard Price) x Actual Quantity $ D Actual Hours/Qty Variance Actual Rate Favorable/ Unfavorable Milestone Three Guidelines and Rubric ✓ Listen Scenario It has now been one month since you launched your business. You are meeting with a few investors soon to share your vision for the company and to ask for more funding. You will be sharing your company's financial health at this meeting. To do that, you need to determine and analyze your company's performance over the last month using the data provided. Prompt Use the information in the Milestone Three Actual Costs and Revenue Data Appendix to evaluate your company's performance, and complete the remaining tabs in the Project Workbook that you used for the Milestone One and Two assignments. Specifically, you must address the following rubric criteria: • Statement of Cost of Goods Sold: Prepare the statement of cost of goods sold in the "COGS" tab of the workbook. Remember to show your work using calculations to the side of the table or using appropriate formulas in the table. • Income Statement: Use the given revenue data to prepare the "Income Statement" tab table and calculate the net income. Remember to show your work using calculations to the side of the table or using appropriate formulas in the table. • Variance Analysis: Prepare the data in the "Variances" tab to determine whether the variances are favorable or unfavorable. Remember to show your work using calculations to the side of the table or using appropriate formulas in the table. - Complete the data table for the variances by entering the budgeted (standard) and actual labor and material values. Remember to use the estimates for expected sales from your Milestone Two assignment. > Determine the variances for direct labor and direct materials in the "Variances" tab. + Evaluate the significance of the variances in the "Variances" tab, and mark them as favorable or unfavorable. Guidelines for Submission Submit the Project Workbook with all tabs completed. This file should be completed and submitted using Microsoft Excel. For your statement of cost of goods sold, use the following data regarding the actual costs incurred by the business over the past month: . . ● Overhead costs: $3,765 Note: Assume that the beginning materials and ending work in process are zero for the month. Use the following revenue and cost information for the income statement. Note that the revenue you use will depend on the pricing level options you chose in Milestone Two. Also, assume that after accounting for weekends and other holidays, there were 20 business days in the first month of operation. For example, if you chose a sales price of $20 per collar, the actual number of collars sold in the month was 33 per day or 33 x 20 = 660 per month. Established Sales Price Collars $20 $24 $28 Leashes $22 $26 $30 Harnesses $25 $30 $35 Materials purchased: $20,000 o Consumed 80% of the purchased materials Direct labor: $8,493.33 . . . . The other costs incurred by the business include: General and administrative salaries o Receptionist: $1,950 O Owner salary: $500 . · Number of Items Sold per Day 33 28 23 28 23 18. 25 22 20 Depreciation: $165 Rent: $750 Utilities and insurance: $600 Scissors, thread, and cording: $1,200 Loan repayment: $550 Variance At the end of the month, you find that the labor and materials spent on manufacturing collars was different from what you estimated: • The collar maker had to work nine hours a day instead of eight due to an increased demand for collars. Because of the increased demand, the hourly rate you paid your employee for making the collars increased to $16.50. ● . • An increase in the cost of raw material led the direct material cost per collar to increase to $10. However, you also made and sold 60 more collars than you expected to sell in the month. You now need to determine the variance in the materials and labor cost from what you estimated in Milestone Two based on the market research data. 1 2 Milestone Three - Statement of Cost of Goods Sold 3 4 6 Beginning Work in Process Inventory 7 Direct Materials: 8 9 11 12 A Materials: Beginning Add: Purchases for month of January 14 15 16 Direct Labor 17 Overhead 24 25 26 Materials available for use Deduct: Ending materials Materials Used 19 Total Costs 20 21 Deduct: Ending Work in Process Inventory 22 23 Cost of Goods Sold 565 B CASTAM 0 C 0 III D 2 Milestone Three - Income Statement 3 4 5 6 7 8 9 10 Total Revenue: 11 Cost of goods sold 12 Gross profit 13. 222 Revenue: 14 Expenses: 15 16 17 18 19 21 Collars Leashes Harnesses 222 20 Loan General and administrative salaries Depreciation 22 Total Expenses 23 27 29 30 31 32 A Rent Utilities and insurance Scissors, thread, and cording 24 Net Income/Loss $ $ B S $ S $ 1 2 Milestone Three - Variance Analysis 3 4 5 Data for Variance Analysis: 6789 8 Labor 10 11 Materials. 0123 A 12 13 14 15 Variances for Collar Sales B 28 29 30 Budgeted (Standard) Hours/Qty 16 17 Direct Labor Time Variance 18 19 20 Direct Labor Rate Variance 21 22 23 Direct Materials Quantity/Efficiency Variance 24 25 26 Direct Materials Price Variance 27 (Actual Hours - Standard Hours) x Standard Rate (Actual Rate - Standard Rate) x Actual Hours Budgeted (Standard) Rate (Actual Quantity - Standard Quantity) x Standard Price (Actual Price - Standard Price) x Actual Quantity $ D Actual Hours/Qty Variance Actual Rate Favorable/ Unfavorable Milestone Three Guidelines and Rubric ✓ Listen Scenario It has now been one month since you launched your business. You are meeting with a few investors soon to share your vision for the company and to ask for more funding. You will be sharing your company's financial health at this meeting. To do that, you need to determine and analyze your company's performance over the last month using the data provided. Prompt Use the information in the Milestone Three Actual Costs and Revenue Data Appendix to evaluate your company's performance, and complete the remaining tabs in the Project Workbook that you used for the Milestone One and Two assignments. Specifically, you must address the following rubric criteria: • Statement of Cost of Goods Sold: Prepare the statement of cost of goods sold in the "COGS" tab of the workbook. Remember to show your work using calculations to the side of the table or using appropriate formulas in the table. • Income Statement: Use the given revenue data to prepare the "Income Statement" tab table and calculate the net income. Remember to show your work using calculations to the side of the table or using appropriate formulas in the table. • Variance Analysis: Prepare the data in the "Variances" tab to determine whether the variances are favorable or unfavorable. Remember to show your work using calculations to the side of the table or using appropriate formulas in the table. - Complete the data table for the variances by entering the budgeted (standard) and actual labor and material values. Remember to use the estimates for expected sales from your Milestone Two assignment. > Determine the variances for direct labor and direct materials in the "Variances" tab. + Evaluate the significance of the variances in the "Variances" tab, and mark them as favorable or unfavorable. Guidelines for Submission Submit the Project Workbook with all tabs completed. This file should be completed and submitted using Microsoft Excel. For your statement of cost of goods sold, use the following data regarding the actual costs incurred by the business over the past month: . . ● Overhead costs: $3,765 Note: Assume that the beginning materials and ending work in process are zero for the month. Use the following revenue and cost information for the income statement. Note that the revenue you use will depend on the pricing level options you chose in Milestone Two. Also, assume that after accounting for weekends and other holidays, there were 20 business days in the first month of operation. For example, if you chose a sales price of $20 per collar, the actual number of collars sold in the month was 33 per day or 33 x 20 = 660 per month. Established Sales Price Collars $20 $24 $28 Leashes $22 $26 $30 Harnesses $25 $30 $35 Materials purchased: $20,000 o Consumed 80% of the purchased materials Direct labor: $8,493.33 . . . . The other costs incurred by the business include: General and administrative salaries o Receptionist: $1,950 O Owner salary: $500 . · Number of Items Sold per Day 33 28 23 28 23 18. 25 22 20 Depreciation: $165 Rent: $750 Utilities and insurance: $600 Scissors, thread, and cording: $1,200 Loan repayment: $550 Variance At the end of the month, you find that the labor and materials spent on manufacturing collars was different from what you estimated: • The collar maker had to work nine hours a day instead of eight due to an increased demand for collars. Because of the increased demand, the hourly rate you paid your employee for making the collars increased to $16.50. ● . • An increase in the cost of raw material led the direct material cost per collar to increase to $10. However, you also made and sold 60 more collars than you expected to sell in the month. You now need to determine the variance in the materials and labor cost from what you estimated in Milestone Two based on the market research data. 1 2 Milestone Three - Statement of Cost of Goods Sold 3 4 6 Beginning Work in Process Inventory 7 Direct Materials: 8 9 11 12 A Materials: Beginning Add: Purchases for month of January 14 15 16 Direct Labor 17 Overhead 24 25 26 Materials available for use Deduct: Ending materials Materials Used 19 Total Costs 20 21 Deduct: Ending Work in Process Inventory 22 23 Cost of Goods Sold 565 B CASTAM 0 C 0 III D 2 Milestone Three - Income Statement 3 4 5 6 7 8 9 10 Total Revenue: 11 Cost of goods sold 12 Gross profit 13. 222 Revenue: 14 Expenses: 15 16 17 18 19 21 Collars Leashes Harnesses 222 20 Loan General and administrative salaries Depreciation 22 Total Expenses 23 27 29 30 31 32 A Rent Utilities and insurance Scissors, thread, and cording 24 Net Income/Loss $ $ B S $ S $ 1 2 Milestone Three - Variance Analysis 3 4 5 Data for Variance Analysis: 6789 8 Labor 10 11 Materials. 0123 A 12 13 14 15 Variances for Collar Sales B 28 29 30 Budgeted (Standard) Hours/Qty 16 17 Direct Labor Time Variance 18 19 20 Direct Labor Rate Variance 21 22 23 Direct Materials Quantity/Efficiency Variance 24 25 26 Direct Materials Price Variance 27 (Actual Hours - Standard Hours) x Standard Rate (Actual Rate - Standard Rate) x Actual Hours Budgeted (Standard) Rate (Actual Quantity - Standard Quantity) x Standard Price (Actual Price - Standard Price) x Actual Quantity $ D Actual Hours/Qty Variance Actual Rate Favorable/ Unfavorable Milestone Three Guidelines and Rubric ✓ Listen Scenario It has now been one month since you launched your business. You are meeting with a few investors soon to share your vision for the company and to ask for more funding. You will be sharing your company's financial health at this meeting. To do that, you need to determine and analyze your company's performance over the last month using the data provided. Prompt Use the information in the Milestone Three Actual Costs and Revenue Data Appendix to evaluate your company's performance, and complete the remaining tabs in the Project Workbook that you used for the Milestone One and Two assignments. Specifically, you must address the following rubric criteria: • Statement of Cost of Goods Sold: Prepare the statement of cost of goods sold in the "COGS" tab of the workbook. Remember to show your work using calculations to the side of the table or using appropriate formulas in the table. • Income Statement: Use the given revenue data to prepare the "Income Statement" tab table and calculate the net income. Remember to show your work using calculations to the side of the table or using appropriate formulas in the table. • Variance Analysis: Prepare the data in the "Variances" tab to determine whether the variances are favorable or unfavorable. Remember to show your work using calculations to the side of the table or using appropriate formulas in the table. - Complete the data table for the variances by entering the budgeted (standard) and actual labor and material values. Remember to use the estimates for expected sales from your Milestone Two assignment. > Determine the variances for direct labor and direct materials in the "Variances" tab. + Evaluate the significance of the variances in the "Variances" tab, and mark them as favorable or unfavorable. Guidelines for Submission Submit the Project Workbook with all tabs completed. This file should be completed and submitted using Microsoft Excel. For your statement of cost of goods sold, use the following data regarding the actual costs incurred by the business over the past month: . . ● Overhead costs: $3,765 Note: Assume that the beginning materials and ending work in process are zero for the month. Use the following revenue and cost information for the income statement. Note that the revenue you use will depend on the pricing level options you chose in Milestone Two. Also, assume that after accounting for weekends and other holidays, there were 20 business days in the first month of operation. For example, if you chose a sales price of $20 per collar, the actual number of collars sold in the month was 33 per day or 33 x 20 = 660 per month. Established Sales Price Collars $20 $24 $28 Leashes $22 $26 $30 Harnesses $25 $30 $35 Materials purchased: $20,000 o Consumed 80% of the purchased materials Direct labor: $8,493.33 . . . . The other costs incurred by the business include: General and administrative salaries o Receptionist: $1,950 O Owner salary: $500 . · Number of Items Sold per Day 33 28 23 28 23 18. 25 22 20 Depreciation: $165 Rent: $750 Utilities and insurance: $600 Scissors, thread, and cording: $1,200 Loan repayment: $550 Variance At the end of the month, you find that the labor and materials spent on manufacturing collars was different from what you estimated: • The collar maker had to work nine hours a day instead of eight due to an increased demand for collars. Because of the increased demand, the hourly rate you paid your employee for making the collars increased to $16.50. ● . • An increase in the cost of raw material led the direct material cost per collar to increase to $10. However, you also made and sold 60 more collars than you expected to sell in the month. You now need to determine the variance in the materials and labor cost from what you estimated in Milestone Two based on the market research data. 1 2 Milestone Three - Statement of Cost of Goods Sold 3 4 6 Beginning Work in Process Inventory 7 Direct Materials: 8 9 11 12 A Materials: Beginning Add: Purchases for month of January 14 15 16 Direct Labor 17 Overhead 24 25 26 Materials available for use Deduct: Ending materials Materials Used 19 Total Costs 20 21 Deduct: Ending Work in Process Inventory 22 23 Cost of Goods Sold 565 B CASTAM 0 C 0 III D 2 Milestone Three - Income Statement 3 4 5 6 7 8 9 10 Total Revenue: 11 Cost of goods sold 12 Gross profit 13. 222 Revenue: 14 Expenses: 15 16 17 18 19 21 Collars Leashes Harnesses 222 20 Loan General and administrative salaries Depreciation 22 Total Expenses 23 27 29 30 31 32 A Rent Utilities and insurance Scissors, thread, and cording 24 Net Income/Loss $ $ B S $ S $ 1 2 Milestone Three - Variance Analysis 3 4 5 Data for Variance Analysis: 6789 8 Labor 10 11 Materials. 0123 A 12 13 14 15 Variances for Collar Sales B 28 29 30 Budgeted (Standard) Hours/Qty 16 17 Direct Labor Time Variance 18 19 20 Direct Labor Rate Variance 21 22 23 Direct Materials Quantity/Efficiency Variance 24 25 26 Direct Materials Price Variance 27 (Actual Hours - Standard Hours) x Standard Rate (Actual Rate - Standard Rate) x Actual Hours Budgeted (Standard) Rate (Actual Quantity - Standard Quantity) x Standard Price (Actual Price - Standard Price) x Actual Quantity $ D Actual Hours/Qty Variance Actual Rate Favorable/ Unfavorable Milestone Three Guidelines and Rubric ✓ Listen Scenario It has now been one month since you launched your business. You are meeting with a few investors soon to share your vision for the company and to ask for more funding. You will be sharing your company's financial health at this meeting. To do that, you need to determine and analyze your company's performance over the last month using the data provided. Prompt Use the information in the Milestone Three Actual Costs and Revenue Data Appendix to evaluate your company's performance, and complete the remaining tabs in the Project Workbook that you used for the Milestone One and Two assignments. Specifically, you must address the following rubric criteria: • Statement of Cost of Goods Sold: Prepare the statement of cost of goods sold in the "COGS" tab of the workbook. Remember to show your work using calculations to the side of the table or using appropriate formulas in the table. • Income Statement: Use the given revenue data to prepare the "Income Statement" tab table and calculate the net income. Remember to show your work using calculations to the side of the table or using appropriate formulas in the table. • Variance Analysis: Prepare the data in the "Variances" tab to determine whether the variances are favorable or unfavorable. Remember to show your work using calculations to the side of the table or using appropriate formulas in the table. - Complete the data table for the variances by entering the budgeted (standard) and actual labor and material values. Remember to use the estimates for expected sales from your Milestone Two assignment. > Determine the variances for direct labor and direct materials in the "Variances" tab. + Evaluate the significance of the variances in the "Variances" tab, and mark them as favorable or unfavorable. Guidelines for Submission Submit the Project Workbook with all tabs completed. This file should be completed and submitted using Microsoft Excel. For your statement of cost of goods sold, use the following data regarding the actual costs incurred by the business over the past month: . . ● Overhead costs: $3,765 Note: Assume that the beginning materials and ending work in process are zero for the month. Use the following revenue and cost information for the income statement. Note that the revenue you use will depend on the pricing level options you chose in Milestone Two. Also, assume that after accounting for weekends and other holidays, there were 20 business days in the first month of operation. For example, if you chose a sales price of $20 per collar, the actual number of collars sold in the month was 33 per day or 33 x 20 = 660 per month. Established Sales Price Collars $20 $24 $28 Leashes $22 $26 $30 Harnesses $25 $30 $35 Materials purchased: $20,000 o Consumed 80% of the purchased materials Direct labor: $8,493.33 . . . . The other costs incurred by the business include: General and administrative salaries o Receptionist: $1,950 O Owner salary: $500 . · Number of Items Sold per Day 33 28 23 28 23 18. 25 22 20 Depreciation: $165 Rent: $750 Utilities and insurance: $600 Scissors, thread, and cording: $1,200 Loan repayment: $550 Variance At the end of the month, you find that the labor and materials spent on manufacturing collars was different from what you estimated: • The collar maker had to work nine hours a day instead of eight due to an increased demand for collars. Because of the increased demand, the hourly rate you paid your employee for making the collars increased to $16.50. ● . • An increase in the cost of raw material led the direct material cost per collar to increase to $10. However, you also made and sold 60 more collars than you expected to sell in the month. You now need to determine the variance in the materials and labor cost from what you estimated in Milestone Two based on the market research data. 1 2 Milestone Three - Statement of Cost of Goods Sold 3 4 6 Beginning Work in Process Inventory 7 Direct Materials: 8 9 11 12 A Materials: Beginning Add: Purchases for month of January 14 15 16 Direct Labor 17 Overhead 24 25 26 Materials available for use Deduct: Ending materials Materials Used 19 Total Costs 20 21 Deduct: Ending Work in Process Inventory 22 23 Cost of Goods Sold 565 B CASTAM 0 C 0 III D 2 Milestone Three - Income Statement 3 4 5 6 7 8 9 10 Total Revenue: 11 Cost of goods sold 12 Gross profit 13. 222 Revenue: 14 Expenses: 15 16 17 18 19 21 Collars Leashes Harnesses 222 20 Loan General and administrative salaries Depreciation 22 Total Expenses 23 27 29 30 31 32 A Rent Utilities and insurance Scissors, thread, and cording 24 Net Income/Loss $ $ B S $ S $ 1 2 Milestone Three - Variance Analysis 3 4 5 Data for Variance Analysis: 6789 8 Labor 10 11 Materials. 0123 A 12 13 14 15 Variances for Collar Sales B 28 29 30 Budgeted (Standard) Hours/Qty 16 17 Direct Labor Time Variance 18 19 20 Direct Labor Rate Variance 21 22 23 Direct Materials Quantity/Efficiency Variance 24 25 26 Direct Materials Price Variance 27 (Actual Hours - Standard Hours) x Standard Rate (Actual Rate - Standard Rate) x Actual Hours Budgeted (Standard) Rate (Actual Quantity - Standard Quantity) x Standard Price (Actual Price - Standard Price) x Actual Quantity $ D Actual Hours/Qty Variance Actual Rate Favorable/ Unfavorable Milestone Three Guidelines and Rubric ✓ Listen Scenario It has now been one month since you launched your business. You are meeting with a few investors soon to share your vision for the company and to ask for more funding. You will be sharing your company's financial health at this meeting. To do that, you need to determine and analyze your company's performance over the last month using the data provided. Prompt Use the information in the Milestone Three Actual Costs and Revenue Data Appendix to evaluate your company's performance, and complete the remaining tabs in the Project Workbook that you used for the Milestone One and Two assignments. Specifically, you must address the following rubric criteria: • Statement of Cost of Goods Sold: Prepare the statement of cost of goods sold in the "COGS" tab of the workbook. Remember to show your work using calculations to the side of the table or using appropriate formulas in the table. • Income Statement: Use the given revenue data to prepare the "Income Statement" tab table and calculate the net income. Remember to show your work using calculations to the side of the table or using appropriate formulas in the table. • Variance Analysis: Prepare the data in the "Variances" tab to determine whether the variances are favorable or unfavorable. Remember to show your work using calculations to the side of the table or using appropriate formulas in the table. - Complete the data table for the variances by entering the budgeted (standard) and actual labor and material values. Remember to use the estimates for expected sales from your Milestone Two assignment. > Determine the variances for direct labor and direct materials in the "Variances" tab. + Evaluate the significance of the variances in the "Variances" tab, and mark them as favorable or unfavorable. Guidelines for Submission Submit the Project Workbook with all tabs completed. This file should be completed and submitted using Microsoft Excel. For your statement of cost of goods sold, use the following data regarding the actual costs incurred by the business over the past month: . . ● Overhead costs: $3,765 Note: Assume that the beginning materials and ending work in process are zero for the month. Use the following revenue and cost information for the income statement. Note that the revenue you use will depend on the pricing level options you chose in Milestone Two. Also, assume that after accounting for weekends and other holidays, there were 20 business days in the first month of operation. For example, if you chose a sales price of $20 per collar, the actual number of collars sold in the month was 33 per day or 33 x 20 = 660 per month. Established Sales Price Collars $20 $24 $28 Leashes $22 $26 $30 Harnesses $25 $30 $35 Materials purchased: $20,000 o Consumed 80% of the purchased materials Direct labor: $8,493.33 . . . . The other costs incurred by the business include: General and administrative salaries o Receptionist: $1,950 O Owner salary: $500 . · Number of Items Sold per Day 33 28 23 28 23 18. 25 22 20 Depreciation: $165 Rent: $750 Utilities and insurance: $600 Scissors, thread, and cording: $1,200 Loan repayment: $550 Variance At the end of the month, you find that the labor and materials spent on manufacturing collars was different from what you estimated: • The collar maker had to work nine hours a day instead of eight due to an increased demand for collars. Because of the increased demand, the hourly rate you paid your employee for making the collars increased to $16.50. ● . • An increase in the cost of raw material led the direct material cost per collar to increase to $10. However, you also made and sold 60 more collars than you expected to sell in the month. You now need to determine the variance in the materials and labor cost from what you estimated in Milestone Two based on the market research data. 1 2 Milestone Three - Statement of Cost of Goods Sold 3 4 6 Beginning Work in Process Inventory 7 Direct Materials: 8 9 11 12 A Materials: Beginning Add: Purchases for month of January 14 15 16 Direct Labor 17 Overhead 24 25 26 Materials available for use Deduct: Ending materials Materials Used 19 Total Costs 20 21 Deduct: Ending Work in Process Inventory 22 23 Cost of Goods Sold 565 B CASTAM 0 C 0 III D 2 Milestone Three - Income Statement 3 4 5 6 7 8 9 10 Total Revenue: 11 Cost of goods sold 12 Gross profit 13. 222 Revenue: 14 Expenses: 15 16 17 18 19 21 Collars Leashes Harnesses 222 20 Loan General and administrative salaries Depreciation 22 Total Expenses 23 27 29 30 31 32 A Rent Utilities and insurance Scissors, thread, and cording 24 Net Income/Loss $ $ B S $ S $ 1 2 Milestone Three - Variance Analysis 3 4 5 Data for Variance Analysis: 6789 8 Labor 10 11 Materials. 0123 A 12 13 14 15 Variances for Collar Sales B 28 29 30 Budgeted (Standard) Hours/Qty 16 17 Direct Labor Time Variance 18 19 20 Direct Labor Rate Variance 21 22 23 Direct Materials Quantity/Efficiency Variance 24 25 26 Direct Materials Price Variance 27 (Actual Hours - Standard Hours) x Standard Rate (Actual Rate - Standard Rate) x Actual Hours Budgeted (Standard) Rate (Actual Quantity - Standard Quantity) x Standard Price (Actual Price - Standard Price) x Actual Quantity $ D Actual Hours/Qty Variance Actual Rate Favorable/ Unfavorable Milestone Three Guidelines and Rubric ✓ Listen Scenario It has now been one month since you launched your business. You are meeting with a few investors soon to share your vision for the company and to ask for more funding. You will be sharing your company's financial health at this meeting. To do that, you need to determine and analyze your company's performance over the last month using the data provided. Prompt Use the information in the Milestone Three Actual Costs and Revenue Data Appendix to evaluate your company's performance, and complete the remaining tabs in the Project Workbook that you used for the Milestone One and Two assignments. Specifically, you must address the following rubric criteria: • Statement of Cost of Goods Sold: Prepare the statement of cost of goods sold in the "COGS" tab of the workbook. Remember to show your work using calculations to the side of the table or using appropriate formulas in the table. • Income Statement: Use the given revenue data to prepare the "Income Statement" tab table and calculate the net income. Remember to show your work using calculations to the side of the table or using appropriate formulas in the table. • Variance Analysis: Prepare the data in the "Variances" tab to determine whether the variances are favorable or unfavorable. Remember to show your work using calculations to the side of the table or using appropriate formulas in the table. - Complete the data table for the variances by entering the budgeted (standard) and actual labor and material values. Remember to use the estimates for expected sales from your Milestone Two assignment. > Determine the variances for direct labor and direct materials in the "Variances" tab. + Evaluate the significance of the variances in the "Variances" tab, and mark them as favorable or unfavorable. Guidelines for Submission Submit the Project Workbook with all tabs completed. This file should be completed and submitted using Microsoft Excel. For your statement of cost of goods sold, use the following data regarding the actual costs incurred by the business over the past month: . . ● Overhead costs: $3,765 Note: Assume that the beginning materials and ending work in process are zero for the month. Use the following revenue and cost information for the income statement. Note that the revenue you use will depend on the pricing level options you chose in Milestone Two. Also, assume that after accounting for weekends and other holidays, there were 20 business days in the first month of operation. For example, if you chose a sales price of $20 per collar, the actual number of collars sold in the month was 33 per day or 33 x 20 = 660 per month. Established Sales Price Collars $20 $24 $28 Leashes $22 $26 $30 Harnesses $25 $30 $35 Materials purchased: $20,000 o Consumed 80% of the purchased materials Direct labor: $8,493.33 . . . . The other costs incurred by the business include: General and administrative salaries o Receptionist: $1,950 O Owner salary: $500 . · Number of Items Sold per Day 33 28 23 28 23 18. 25 22 20 Depreciation: $165 Rent: $750 Utilities and insurance: $600 Scissors, thread, and cording: $1,200 Loan repayment: $550 Variance At the end of the month, you find that the labor and materials spent on manufacturing collars was different from what you estimated: • The collar maker had to work nine hours a day instead of eight due to an increased demand for collars. Because of the increased demand, the hourly rate you paid your employee for making the collars increased to $16.50. ● . • An increase in the cost of raw material led the direct material cost per collar to increase to $10. However, you also made and sold 60 more collars than you expected to sell in the month. You now need to determine the variance in the materials and labor cost from what you estimated in Milestone Two based on the market research data. 1 2 Milestone Three - Statement of Cost of Goods Sold 3 4 6 Beginning Work in Process Inventory 7 Direct Materials: 8 9 11 12 A Materials: Beginning Add: Purchases for month of January 14 15 16 Direct Labor 17 Overhead 24 25 26 Materials available for use Deduct: Ending materials Materials Used 19 Total Costs 20 21 Deduct: Ending Work in Process Inventory 22 23 Cost of Goods Sold 565 B CASTAM 0 C 0 III D 2 Milestone Three - Income Statement 3 4 5 6 7 8 9 10 Total Revenue: 11 Cost of goods sold 12 Gross profit 13. 222 Revenue: 14 Expenses: 15 16 17 18 19 21 Collars Leashes Harnesses 222 20 Loan General and administrative salaries Depreciation 22 Total Expenses 23 27 29 30 31 32 A Rent Utilities and insurance Scissors, thread, and cording 24 Net Income/Loss $ $ B S $ S $ 1 2 Milestone Three - Variance Analysis 3 4 5 Data for Variance Analysis: 6789 8 Labor 10 11 Materials. 0123 A 12 13 14 15 Variances for Collar Sales B 28 29 30 Budgeted (Standard) Hours/Qty 16 17 Direct Labor Time Variance 18 19 20 Direct Labor Rate Variance 21 22 23 Direct Materials Quantity/Efficiency Variance 24 25 26 Direct Materials Price Variance 27 (Actual Hours - Standard Hours) x Standard Rate (Actual Rate - Standard Rate) x Actual Hours Budgeted (Standard) Rate (Actual Quantity - Standard Quantity) x Standard Price (Actual Price - Standard Price) x Actual Quantity $ D Actual Hours/Qty Variance Actual Rate Favorable/ Unfavorable Milestone Three Guidelines and Rubric ✓ Listen Scenario It has now been one month since you launched your business. You are meeting with a few investors soon to share your vision for the company and to ask for more funding. You will be sharing your company's financial health at this meeting. To do that, you need to determine and analyze your company's performance over the last month using the data provided. Prompt Use the information in the Milestone Three Actual Costs and Revenue Data Appendix to evaluate your company's performance, and complete the remaining tabs in the Project Workbook that you used for the Milestone One and Two assignments. Specifically, you must address the following rubric criteria: • Statement of Cost of Goods Sold: Prepare the statement of cost of goods sold in the "COGS" tab of the workbook. Remember to show your work using calculations to the side of the table or using appropriate formulas in the table. • Income Statement: Use the given revenue data to prepare the "Income Statement" tab table and calculate the net income. Remember to show your work using calculations to the side of the table or using appropriate formulas in the table. • Variance Analysis: Prepare the data in the "Variances" tab to determine whether the variances are favorable or unfavorable. Remember to show your work using calculations to the side of the table or using appropriate formulas in the table. - Complete the data table for the variances by entering the budgeted (standard) and actual labor and material values. Remember to use the estimates for expected sales from your Milestone Two assignment. > Determine the variances for direct labor and direct materials in the "Variances" tab. + Evaluate the significance of the variances in the "Variances" tab, and mark them as favorable or unfavorable. Guidelines for Submission Submit the Project Workbook with all tabs completed. This file should be completed and submitted using Microsoft Excel. For your statement of cost of goods sold, use the following data regarding the actual costs incurred by the business over the past month: . . ● Overhead costs: $3,765 Note: Assume that the beginning materials and ending work in process are zero for the month. Use the following revenue and cost information for the income statement. Note that the revenue you use will depend on the pricing level options you chose in Milestone Two. Also, assume that after accounting for weekends and other holidays, there were 20 business days in the first month of operation. For example, if you chose a sales price of $20 per collar, the actual number of collars sold in the month was 33 per day or 33 x 20 = 660 per month. Established Sales Price Collars $20 $24 $28 Leashes $22 $26 $30 Harnesses $25 $30 $35 Materials purchased: $20,000 o Consumed 80% of the purchased materials Direct labor: $8,493.33 . . . . The other costs incurred by the business include: General and administrative salaries o Receptionist: $1,950 O Owner salary: $500 . · Number of Items Sold per Day 33 28 23 28 23 18. 25 22 20 Depreciation: $165 Rent: $750 Utilities and insurance: $600 Scissors, thread, and cording: $1,200 Loan repayment: $550 Variance At the end of the month, you find that the labor and materials spent on manufacturing collars was different from what you estimated: • The collar maker had to work nine hours a day instead of eight due to an increased demand for collars. Because of the increased demand, the hourly rate you paid your employee for making the collars increased to $16.50. ● . • An increase in the cost of raw material led the direct material cost per collar to increase to $10. However, you also made and sold 60 more collars than you expected to sell in the month. You now need to determine the variance in the materials and labor cost from what you estimated in Milestone Two based on the market research data. 1 2 Milestone Three - Statement of Cost of Goods Sold 3 4 6 Beginning Work in Process Inventory 7 Direct Materials: 8 9 11 12 A Materials: Beginning Add: Purchases for month of January 14 15 16 Direct Labor 17 Overhead 24 25 26 Materials available for use Deduct: Ending materials Materials Used 19 Total Costs 20 21 Deduct: Ending Work in Process Inventory 22 23 Cost of Goods Sold 565 B CASTAM 0 C 0 III D 2 Milestone Three - Income Statement 3 4 5 6 7 8 9 10 Total Revenue: 11 Cost of goods sold 12 Gross profit 13. 222 Revenue: 14 Expenses: 15 16 17 18 19 21 Collars Leashes Harnesses 222 20 Loan General and administrative salaries Depreciation 22 Total Expenses 23 27 29 30 31 32 A Rent Utilities and insurance Scissors, thread, and cording 24 Net Income/Loss $ $ B S $ S $ 1 2 Milestone Three - Variance Analysis 3 4 5 Data for Variance Analysis: 6789 8 Labor 10 11 Materials. 0123 A 12 13 14 15 Variances for Collar Sales B 28 29 30 Budgeted (Standard) Hours/Qty 16 17 Direct Labor Time Variance 18 19 20 Direct Labor Rate Variance 21 22 23 Direct Materials Quantity/Efficiency Variance 24 25 26 Direct Materials Price Variance 27 (Actual Hours - Standard Hours) x Standard Rate (Actual Rate - Standard Rate) x Actual Hours Budgeted (Standard) Rate (Actual Quantity - Standard Quantity) x Standard Price (Actual Price - Standard Price) x Actual Quantity $ D Actual Hours/Qty Variance Actual Rate Favorable/ Unfavorable Milestone Three Guidelines and Rubric ✓ Listen Scenario It has now been one month since you launched your business. You are meeting with a few investors soon to share your vision for the company and to ask for more funding. You will be sharing your company's financial health at this meeting. To do that, you need to determine and analyze your company's performance over the last month using the data provided. Prompt Use the information in the Milestone Three Actual Costs and Revenue Data Appendix to evaluate your company's performance, and complete the remaining tabs in the Project Workbook that you used for the Milestone One and Two assignments. Specifically, you must address the following rubric criteria: • Statement of Cost of Goods Sold: Prepare the statement of cost of goods sold in the "COGS" tab of the workbook. Remember to show your work using calculations to the side of the table or using appropriate formulas in the table. • Income Statement: Use the given revenue data to prepare the "Income Statement" tab table and calculate the net income. Remember to show your work using calculations to the side of the table or using appropriate formulas in the table. • Variance Analysis: Prepare the data in the "Variances" tab to determine whether the variances are favorable or unfavorable. Remember to show your work using calculations to the side of the table or using appropriate formulas in the table. - Complete the data table for the variances by entering the budgeted (standard) and actual labor and material values. Remember to use the estimates for expected sales from your Milestone Two assignment. > Determine the variances for direct labor and direct materials in the "Variances" tab. + Evaluate the significance of the variances in the "Variances" tab, and mark them as favorable or unfavorable. Guidelines for Submission Submit the Project Workbook with all tabs completed. This file should be completed and submitted using Microsoft Excel. For your statement of cost of goods sold, use the following data regarding the actual costs incurred by the business over the past month: . . ● Overhead costs: $3,765 Note: Assume that the beginning materials and ending work in process are zero for the month. Use the following revenue and cost information for the income statement. Note that the revenue you use will depend on the pricing level options you chose in Milestone Two. Also, assume that after accounting for weekends and other holidays, there were 20 business days in the first month of operation. For example, if you chose a sales price of $20 per collar, the actual number of collars sold in the month was 33 per day or 33 x 20 = 660 per month. Established Sales Price Collars $20 $24 $28 Leashes $22 $26 $30 Harnesses $25 $30 $35 Materials purchased: $20,000 o Consumed 80% of the purchased materials Direct labor: $8,493.33 . . . . The other costs incurred by the business include: General and administrative salaries o Receptionist: $1,950 O Owner salary: $500 . · Number of Items Sold per Day 33 28 23 28 23 18. 25 22 20 Depreciation: $165 Rent: $750 Utilities and insurance: $600 Scissors, thread, and cording: $1,200 Loan repayment: $550 Variance At the end of the month, you find that the labor and materials spent on manufacturing collars was different from what you estimated: • The collar maker had to work nine hours a day instead of eight due to an increased demand for collars. Because of the increased demand, the hourly rate you paid your employee for making the collars increased to $16.50. ● . • An increase in the cost of raw material led the direct material cost per collar to increase to $10. However, you also made and sold 60 more collars than you expected to sell in the month. You now need to determine the variance in the materials and labor cost from what you estimated in Milestone Two based on the market research data. 1 2 Milestone Three - Statement of Cost of Goods Sold 3 4 6 Beginning Work in Process Inventory 7 Direct Materials: 8 9 11 12 A Materials: Beginning Add: Purchases for month of January 14 15 16 Direct Labor 17 Overhead 24 25 26 Materials available for use Deduct: Ending materials Materials Used 19 Total Costs 20 21 Deduct: Ending Work in Process Inventory 22 23 Cost of Goods Sold 565 B CASTAM 0 C 0 III D 2 Milestone Three - Income Statement 3 4 5 6 7 8 9 10 Total Revenue: 11 Cost of goods sold 12 Gross profit 13. 222 Revenue: 14 Expenses: 15 16 17 18 19 21 Collars Leashes Harnesses 222 20 Loan General and administrative salaries Depreciation 22 Total Expenses 23 27 29 30 31 32 A Rent Utilities and insurance Scissors, thread, and cording 24 Net Income/Loss $ $ B S $ S $ 1 2 Milestone Three - Variance Analysis 3 4 5 Data for Variance Analysis: 6789 8 Labor 10 11 Materials. 0123 A 12 13 14 15 Variances for Collar Sales B 28 29 30 Budgeted (Standard) Hours/Qty 16 17 Direct Labor Time Variance 18 19 20 Direct Labor Rate Variance 21 22 23 Direct Materials Quantity/Efficiency Variance 24 25 26 Direct Materials Price Variance 27 (Actual Hours - Standard Hours) x Standard Rate (Actual Rate - Standard Rate) x Actual Hours Budgeted (Standard) Rate (Actual Quantity - Standard Quantity) x Standard Price (Actual Price - Standard Price) x Actual Quantity $ D Actual Hours/Qty Variance Actual Rate Favorable/ Unfavorable Milestone Three Guidelines and Rubric ✓ Listen Scenario It has now been one month since you launched your business. You are meeting with a few investors soon to share your vision for the company and to ask for more funding. You will be sharing your company's financial health at this meeting. To do that, you need to determine and analyze your company's performance over the last month using the data provided. Prompt Use the information in the Milestone Three Actual Costs and Revenue Data Appendix to evaluate your company's performance, and complete the remaining tabs in the Project Workbook that you used for the Milestone One and Two assignments. Specifically, you must address the following rubric criteria: • Statement of Cost of Goods Sold: Prepare the statement of cost of goods sold in the "COGS" tab of the workbook. Remember to show your work using calculations to the side of the table or using appropriate formulas in the table. • Income Statement: Use the given revenue data to prepare the "Income Statement" tab table and calculate the net income. Remember to show your work using calculations to the side of the table or using appropriate formulas in the table. • Variance Analysis: Prepare the data in the "Variances" tab to determine whether the variances are favorable or unfavorable. Remember to show your work using calculations to the side of the table or using appropriate formulas in the table. - Complete the data table for the variances by entering the budgeted (standard) and actual labor and material values. Remember to use the estimates for expected sales from your Milestone Two assignment. > Determine the variances for direct labor and direct materials in the "Variances" tab. + Evaluate the significance of the variances in the "Variances" tab, and mark them as favorable or unfavorable. Guidelines for Submission Submit the Project Workbook with all tabs completed. This file should be completed and submitted using Microsoft Excel. For your statement of cost of goods sold, use the following data regarding the actual costs incurred by the business over the past month: . . ● Overhead costs: $3,765 Note: Assume that the beginning materials and ending work in process are zero for the month. Use the following revenue and cost information for the income statement. Note that the revenue you use will depend on the pricing level options you chose in Milestone Two. Also, assume that after accounting for weekends and other holidays, there were 20 business days in the first month of operation. For example, if you chose a sales price of $20 per collar, the actual number of collars sold in the month was 33 per day or 33 x 20 = 660 per month. Established Sales Price Collars $20 $24 $28 Leashes $22 $26 $30 Harnesses $25 $30 $35 Materials purchased: $20,000 o Consumed 80% of the purchased materials Direct labor: $8,493.33 . . . . The other costs incurred by the business include: General and administrative salaries o Receptionist: $1,950 O Owner salary: $500 . · Number of Items Sold per Day 33 28 23 28 23 18. 25 22 20 Depreciation: $165 Rent: $750 Utilities and insurance: $600 Scissors, thread, and cording: $1,200 Loan repayment: $550 Variance At the end of the month, you find that the labor and materials spent on manufacturing collars was different from what you estimated: • The collar maker had to work nine hours a day instead of eight due to an increased demand for collars. Because of the increased demand, the hourly rate you paid your employee for making the collars increased to $16.50. ● . • An increase in the cost of raw material led the direct material cost per collar to increase to $10. However, you also made and sold 60 more collars than you expected to sell in the month. You now need to determine the variance in the materials and labor cost from what you estimated in Milestone Two based on the market research data. 1 2 Milestone Three - Statement of Cost of Goods Sold 3 4 6 Beginning Work in Process Inventory 7 Direct Materials: 8 9 11 12 A Materials: Beginning Add: Purchases for month of January 14 15 16 Direct Labor 17 Overhead 24 25 26 Materials available for use Deduct: Ending materials Materials Used 19 Total Costs 20 21 Deduct: Ending Work in Process Inventory 22 23 Cost of Goods Sold 565 B CASTAM 0 C 0 III D 2 Milestone Three - Income Statement 3 4 5 6 7 8 9 10 Total Revenue: 11 Cost of goods sold 12 Gross profit 13. 222 Revenue: 14 Expenses: 15 16 17 18 19 21 Collars Leashes Harnesses 222 20 Loan General and administrative salaries Depreciation 22 Total Expenses 23 27 29 30 31 32 A Rent Utilities and insurance Scissors, thread, and cording 24 Net Income/Loss $ $ B S $ S $ 1 2 Milestone Three - Variance Analysis 3 4 5 Data for Variance Analysis: 6789 8 Labor 10 11 Materials. 0123 A 12 13 14 15 Variances for Collar Sales B 28 29 30 Budgeted (Standard) Hours/Qty 16 17 Direct Labor Time Variance 18 19 20 Direct Labor Rate Variance 21 22 23 Direct Materials Quantity/Efficiency Variance 24 25 26 Direct Materials Price Variance 27 (Actual Hours - Standard Hours) x Standard Rate (Actual Rate - Standard Rate) x Actual Hours Budgeted (Standard) Rate (Actual Quantity - Standard Quantity) x Standard Price (Actual Price - Standard Price) x Actual Quantity $ D Actual Hours/Qty Variance Actual Rate Favorable/ Unfavorable Milestone Three Guidelines and Rubric ✓ Listen Scenario It has now been one month since you launched your business. You are meeting with a few investors soon to share your vision for the company and to ask for more funding. You will be sharing your company's financial health at this meeting. To do that, you need to determine and analyze your company's performance over the last month using the data provided. Prompt Use the information in the Milestone Three Actual Costs and Revenue Data Appendix to evaluate your company's performance, and complete the remaining tabs in the Project Workbook that you used for the Milestone One and Two assignments. Specifically, you must address the following rubric criteria: • Statement of Cost of Goods Sold: Prepare the statement of cost of goods sold in the "COGS" tab of the workbook. Remember to show your work using calculations to the side of the table or using appropriate formulas in the table. • Income Statement: Use the given revenue data to prepare the "Income Statement" tab table and calculate the net income. Remember to show your work using calculations to the side of the table or using appropriate formulas in the table. • Variance Analysis: Prepare the data in the "Variances" tab to determine whether the variances are favorable or unfavorable. Remember to show your work using calculations to the side of the table or using appropriate formulas in the table. - Complete the data table for the variances by entering the budgeted (standard) and actual labor and material values. Remember to use the estimates for expected sales from your Milestone Two assignment. > Determine the variances for direct labor and direct materials in the "Variances" tab. + Evaluate the significance of the variances in the "Variances" tab, and mark them as favorable or unfavorable. Guidelines for Submission Submit the Project Workbook with all tabs completed. This file should be completed and submitted using Microsoft Excel. For your statement of cost of goods sold, use the following data regarding the actual costs incurred by the business over the past month: . . ● Overhead costs: $3,765 Note: Assume that the beginning materials and ending work in process are zero for the month. Use the following revenue and cost information for the income statement. Note that the revenue you use will depend on the pricing level options you chose in Milestone Two. Also, assume that after accounting for weekends and other holidays, there were 20 business days in the first month of operation. For example, if you chose a sales price of $20 per collar, the actual number of collars sold in the month was 33 per day or 33 x 20 = 660 per month. Established Sales Price Collars $20 $24 $28 Leashes $22 $26 $30 Harnesses $25 $30 $35 Materials purchased: $20,000 o Consumed 80% of the purchased materials Direct labor: $8,493.33 . . . . The other costs incurred by the business include: General and administrative salaries o Receptionist: $1,950 O Owner salary: $500 . · Number of Items Sold per Day 33 28 23 28 23 18. 25 22 20 Depreciation: $165 Rent: $750 Utilities and insurance: $600 Scissors, thread, and cording: $1,200 Loan repayment: $550 Variance At the end of the month, you find that the labor and materials spent on manufacturing collars was different from what you estimated: • The collar maker had to work nine hours a day instead of eight due to an increased demand for collars. Because of the increased demand, the hourly rate you paid your employee for making the collars increased to $16.50. ● . • An increase in the cost of raw material led the direct material cost per collar to increase to $10. However, you also made and sold 60 more collars than you expected to sell in the month. You now need to determine the variance in the materials and labor cost from what you estimated in Milestone Two based on the market research data. 1 2 Milestone Three - Statement of Cost of Goods Sold 3 4 6 Beginning Work in Process Inventory 7 Direct Materials: 8 9 11 12 A Materials: Beginning Add: Purchases for month of January 14 15 16 Direct Labor 17 Overhead 24 25 26 Materials available for use Deduct: Ending materials Materials Used 19 Total Costs 20 21 Deduct: Ending Work in Process Inventory 22 23 Cost of Goods Sold 565 B CASTAM 0 C 0 III D 2 Milestone Three - Income Statement 3 4 5 6 7 8 9 10 Total Revenue: 11 Cost of goods sold 12 Gross profit 13. 222 Revenue: 14 Expenses: 15 16 17 18 19 21 Collars Leashes Harnesses 222 20 Loan General and administrative salaries Depreciation 22 Total Expenses 23 27 29 30 31 32 A Rent Utilities and insurance Scissors, thread, and cording 24 Net Income/Loss $ $ B S $ S $ 1 2 Milestone Three - Variance Analysis 3 4 5 Data for Variance Analysis: 6789 8 Labor 10 11 Materials. 0123 A 12 13 14 15 Variances for Collar Sales B 28 29 30 Budgeted (Standard) Hours/Qty 16 17 Direct Labor Time Variance 18 19 20 Direct Labor Rate Variance 21 22 23 Direct Materials Quantity/Efficiency Variance 24 25 26 Direct Materials Price Variance 27 (Actual Hours - Standard Hours) x Standard Rate (Actual Rate - Standard Rate) x Actual Hours Budgeted (Standard) Rate (Actual Quantity - Standard Quantity) x Standard Price (Actual Price - Standard Price) x Actual Quantity $ D Actual Hours/Qty Variance Actual Rate Favorable/ Unfavorable Milestone Three Guidelines and Rubric ✓ Listen Scenario It has now been one month since you launched your business. You are meeting with a few investors soon to share your vision for the company and to ask for more funding. You will be sharing your company's financial health at this meeting. To do that, you need to determine and analyze your company's performance over the last month using the data provided. Prompt Use the information in the Milestone Three Actual Costs and Revenue Data Appendix to evaluate your company's performance, and complete the remaining tabs in the Project Workbook that you used for the Milestone One and Two assignments. Specifically, you must address the following rubric criteria: • Statement of Cost of Goods Sold: Prepare the statement of cost of goods sold in the "COGS" tab of the workbook. Remember to show your work using calculations to the side of the table or using appropriate formulas in the table. • Income Statement: Use the given revenue data to prepare the "Income Statement" tab table and calculate the net income. Remember to show your work using calculations to the side of the table or using appropriate formulas in the table. • Variance Analysis: Prepare the data in the "Variances" tab to determine whether the variances are favorable or unfavorable. Remember to show your work using calculations to the side of the table or using appropriate formulas in the table. - Complete the data table for the variances by entering the budgeted (standard) and actual labor and material values. Remember to use the estimates for expected sales from your Milestone Two assignment. > Determine the variances for direct labor and direct materials in the "Variances" tab. + Evaluate the significance of the variances in the "Variances" tab, and mark them as favorable or unfavorable. Guidelines for Submission Submit the Project Workbook with all tabs completed. This file should be completed and submitted using Microsoft Excel. For your statement of cost of goods sold, use the following data regarding the actual costs incurred by the business over the past month: . . ● Overhead costs: $3,765 Note: Assume that the beginning materials and ending work in process are zero for the month. Use the following revenue and cost information for the income statement. Note that the revenue you use will depend on the pricing level options you chose in Milestone Two. Also, assume that after accounting for weekends and other holidays, there were 20 business days in the first month of operation. For example, if you chose a sales price of $20 per collar, the actual number of collars sold in the month was 33 per day or 33 x 20 = 660 per month. Established Sales Price Collars $20 $24 $28 Leashes $22 $26 $30 Harnesses $25 $30 $35 Materials purchased: $20,000 o Consumed 80% of the purchased materials Direct labor: $8,493.33 . . . . The other costs incurred by the business include: General and administrative salaries o Receptionist: $1,950 O Owner salary: $500 . · Number of Items Sold per Day 33 28 23 28 23 18. 25 22 20 Depreciation: $165 Rent: $750 Utilities and insurance: $600 Scissors, thread, and cording: $1,200 Loan repayment: $550 Variance At the end of the month, you find that the labor and materials spent on manufacturing collars was different from what you estimated: • The collar maker had to work nine hours a day instead of eight due to an increased demand for collars. Because of the increased demand, the hourly rate you paid your employee for making the collars increased to $16.50. ● . • An increase in the cost of raw material led the direct material cost per collar to increase to $10. However, you also made and sold 60 more collars than you expected to sell in the month. You now need to determine the variance in the materials and labor cost from what you estimated in Milestone Two based on the market research data. 1 2 Milestone Three - Statement of Cost of Goods Sold 3 4 6 Beginning Work in Process Inventory 7 Direct Materials: 8 9 11 12 A Materials: Beginning Add: Purchases for month of January 14 15 16 Direct Labor 17 Overhead 24 25 26 Materials available for use Deduct: Ending materials Materials Used 19 Total Costs 20 21 Deduct: Ending Work in Process Inventory 22 23 Cost of Goods Sold 565 B CASTAM 0 C 0 III D 2 Milestone Three - Income Statement 3 4 5 6 7 8 9 10 Total Revenue: 11 Cost of goods sold 12 Gross profit 13. 222 Revenue: 14 Expenses: 15 16 17 18 19 21 Collars Leashes Harnesses 222 20 Loan General and administrative salaries Depreciation 22 Total Expenses 23 27 29 30 31 32 A Rent Utilities and insurance Scissors, thread, and cording 24 Net Income/Loss $ $ B S $ S $ 1 2 Milestone Three - Variance Analysis 3 4 5 Data for Variance Analysis: 6789 8 Labor 10 11 Materials. 0123 A 12 13 14 15 Variances for Collar Sales B 28 29 30 Budgeted (Standard) Hours/Qty 16 17 Direct Labor Time Variance 18 19 20 Direct Labor Rate Variance 21 22 23 Direct Materials Quantity/Efficiency Variance 24 25 26 Direct Materials Price Variance 27 (Actual Hours - Standard Hours) x Standard Rate (Actual Rate - Standard Rate) x Actual Hours Budgeted (Standard) Rate (Actual Quantity - Standard Quantity) x Standard Price (Actual Price - Standard Price) x Actual Quantity $ D Actual Hours/Qty Variance Actual Rate Favorable/ Unfavorable Milestone Three Guidelines and Rubric ✓ Listen Scenario It has now been one month since you launched your business. You are meeting with a few investors soon to share your vision for the company and to ask for more funding. You will be sharing your company's financial health at this meeting. To do that, you need to determine and analyze your company's performance over the last month using the data provided. Prompt Use the information in the Milestone Three Actual Costs and Revenue Data Appendix to evaluate your company's performance, and complete the remaining tabs in the Project Workbook that you used for the Milestone One and Two assignments. Specifically, you must address the following rubric criteria: • Statement of Cost of Goods Sold: Prepare the statement of cost of goods sold in the "COGS" tab of the workbook. Remember to show your work using calculations to the side of the table or using appropriate formulas in the table. • Income Statement: Use the given revenue data to prepare the "Income Statement" tab table and calculate the net income. Remember to show your work using calculations to the side of the table or using appropriate formulas in the table. • Variance Analysis: Prepare the data in the "Variances" tab to determine whether the variances are favorable or unfavorable. Remember to show your work using calculations to the side of the table or using appropriate formulas in the table. - Complete the data table for the variances by entering the budgeted (standard) and actual labor and material values. Remember to use the estimates for expected sales from your Milestone Two assignment. > Determine the variances for direct labor and direct materials in the "Variances" tab. + Evaluate the significance of the variances in the "Variances" tab, and mark them as favorable or unfavorable. Guidelines for Submission Submit the Project Workbook with all tabs completed. This file should be completed and submitted using Microsoft Excel. For your statement of cost of goods sold, use the following data regarding the actual costs incurred by the business over the past month: . . ● Overhead costs: $3,765 Note: Assume that the beginning materials and ending work in process are zero for the month. Use the following revenue and cost information for the income statement. Note that the revenue you use will depend on the pricing level options you chose in Milestone Two. Also, assume that after accounting for weekends and other holidays, there were 20 business days in the first month of operation. For example, if you chose a sales price of $20 per collar, the actual number of collars sold in the month was 33 per day or 33 x 20 = 660 per month. Established Sales Price Collars $20 $24 $28 Leashes $22 $26 $30 Harnesses $25 $30 $35 Materials purchased: $20,000 o Consumed 80% of the purchased materials Direct labor: $8,493.33 . . . . The other costs incurred by the business include: General and administrative salaries o Receptionist: $1,950 O Owner salary: $500 . · Number of Items Sold per Day 33 28 23 28 23 18. 25 22 20 Depreciation: $165 Rent: $750 Utilities and insurance: $600 Scissors, thread, and cording: $1,200 Loan repayment: $550 Variance At the end of the month, you find that the labor and materials spent on manufacturing collars was different from what you estimated: • The collar maker had to work nine hours a day instead of eight due to an increased demand for collars. Because of the increased demand, the hourly rate you paid your employee for making the collars increased to $16.50. ● . • An increase in the cost of raw material led the direct material cost per collar to increase to $10. However, you also made and sold 60 more collars than you expected to sell in the month. You now need to determine the variance in the materials and labor cost from what you estimated in Milestone Two based on the market research data. 1 2 Milestone Three - Statement of Cost of Goods Sold 3 4 6 Beginning Work in Process Inventory 7 Direct Materials: 8 9 11 12 A Materials: Beginning Add: Purchases for month of January 14 15 16 Direct Labor 17 Overhead 24 25 26 Materials available for use Deduct: Ending materials Materials Used 19 Total Costs 20 21 Deduct: Ending Work in Process Inventory 22 23 Cost of Goods Sold 565 B CASTAM 0 C 0 III D 2 Milestone Three - Income Statement 3 4 5 6 7 8 9 10 Total Revenue: 11 Cost of goods sold 12 Gross profit 13. 222 Revenue: 14 Expenses: 15 16 17 18 19 21 Collars Leashes Harnesses 222 20 Loan General and administrative salaries Depreciation 22 Total Expenses 23 27 29 30 31 32 A Rent Utilities and insurance Scissors, thread, and cording 24 Net Income/Loss $ $ B S $ S $ 1 2 Milestone Three - Variance Analysis 3 4 5 Data for Variance Analysis: 6789 8 Labor 10 11 Materials. 0123 A 12 13 14 15 Variances for Collar Sales B 28 29 30 Budgeted (Standard) Hours/Qty 16 17 Direct Labor Time Variance 18 19 20 Direct Labor Rate Variance 21 22 23 Direct Materials Quantity/Efficiency Variance 24 25 26 Direct Materials Price Variance 27 (Actual Hours - Standard Hours) x Standard Rate (Actual Rate - Standard Rate) x Actual Hours Budgeted (Standard) Rate (Actual Quantity - Standard Quantity) x Standard Price (Actual Price - Standard Price) x Actual Quantity $ D Actual Hours/Qty Variance Actual Rate Favorable/ Unfavorable Milestone Three Guidelines and Rubric ✓ Listen Scenario It has now been one month since you launched your business. You are meeting with a few investors soon to share your vision for the company and to ask for more funding. You will be sharing your company's financial health at this meeting. To do that, you need to determine and analyze your company's performance over the last month using the data provided. Prompt Use the information in the Milestone Three Actual Costs and Revenue Data Appendix to evaluate your company's performance, and complete the remaining tabs in the Project Workbook that you used for the Milestone One and Two assignments. Specifically, you must address the following rubric criteria: • Statement of Cost of Goods Sold: Prepare the statement of cost of goods sold in the "COGS" tab of the workbook. Remember to show your work using calculations to the side of the table or using appropriate formulas in the table. • Income Statement: Use the given revenue data to prepare the "Income Statement" tab table and calculate the net income. Remember to show your work using calculations to the side of the table or using appropriate formulas in the table. • Variance Analysis: Prepare the data in the "Variances" tab to determine whether the variances are favorable or unfavorable. Remember to show your work using calculations to the side of the table or using appropriate formulas in the table. - Complete the data table for the variances by entering the budgeted (standard) and actual labor and material values. Remember to use the estimates for expected sales from your Milestone Two assignment. > Determine the variances for direct labor and direct materials in the "Variances" tab. + Evaluate the significance of the variances in the "Variances" tab, and mark them as favorable or unfavorable. Guidelines for Submission Submit the Project Workbook with all tabs completed. This file should be completed and submitted using Microsoft Excel. For your statement of cost of goods sold, use the following data regarding the actual costs incurred by the business over the past month: . . ● Overhead costs: $3,765 Note: Assume that the beginning materials and ending work in process are zero for the month. Use the following revenue and cost information for the income statement. Note that the revenue you use will depend on the pricing level options you chose in Milestone Two. Also, assume that after accounting for weekends and other holidays, there were 20 business days in the first month of operation. For example, if you chose a sales price of $20 per collar, the actual number of collars sold in the month was 33 per day or 33 x 20 = 660 per month. Established Sales Price Collars $20 $24 $28 Leashes $22 $26 $30 Harnesses $25 $30 $35 Materials purchased: $20,000 o Consumed 80% of the purchased materials Direct labor: $8,493.33 . . . . The other costs incurred by the business include: General and administrative salaries o Receptionist: $1,950 O Owner salary: $500 . · Number of Items Sold per Day 33 28 23 28 23 18. 25 22 20 Depreciation: $165 Rent: $750 Utilities and insurance: $600 Scissors, thread, and cording: $1,200 Loan repayment: $550 Variance At the end of the month, you find that the labor and materials spent on manufacturing collars was different from what you estimated: • The collar maker had to work nine hours a day instead of eight due to an increased demand for collars. Because of the increased demand, the hourly rate you paid your employee for making the collars increased to $16.50. ● . • An increase in the cost of raw material led the direct material cost per collar to increase to $10. However, you also made and sold 60 more collars than you expected to sell in the month. You now need to determine the variance in the materials and labor cost from what you estimated in Milestone Two based on the market research data. 1 2 Milestone Three - Statement of Cost of Goods Sold 3 4 6 Beginning Work in Process Inventory 7 Direct Materials: 8 9 11 12 A Materials: Beginning Add: Purchases for month of January 14 15 16 Direct Labor 17 Overhead 24 25 26 Materials available for use Deduct: Ending materials Materials Used 19 Total Costs 20 21 Deduct: Ending Work in Process Inventory 22 23 Cost of Goods Sold 565 B CASTAM 0 C 0 III D 2 Milestone Three - Income Statement 3 4 5 6 7 8 9 10 Total Revenue: 11 Cost of goods sold 12 Gross profit 13. 222 Revenue: 14 Expenses: 15 16 17 18 19 21 Collars Leashes Harnesses 222 20 Loan General and administrative salaries Depreciation 22 Total Expenses 23 27 29 30 31 32 A Rent Utilities and insurance Scissors, thread, and cording 24 Net Income/Loss $ $ B S $ S $ 1 2 Milestone Three - Variance Analysis 3 4 5 Data for Variance Analysis: 6789 8 Labor 10 11 Materials. 0123 A 12 13 14 15 Variances for Collar Sales B 28 29 30 Budgeted (Standard) Hours/Qty 16 17 Direct Labor Time Variance 18 19 20 Direct Labor Rate Variance 21 22 23 Direct Materials Quantity/Efficiency Variance 24 25 26 Direct Materials Price Variance 27 (Actual Hours - Standard Hours) x Standard Rate (Actual Rate - Standard Rate) x Actual Hours Budgeted (Standard) Rate (Actual Quantity - Standard Quantity) x Standard Price (Actual Price - Standard Price) x Actual Quantity $ D Actual Hours/Qty Variance Actual Rate Favorable/ Unfavorable Milestone Three Guidelines and Rubric ✓ Listen Scenario It has now been one month since you launched your business. You are meeting with a few investors soon to share your vision for the company and to ask for more funding. You will be sharing your company's financial health at this meeting. To do that, you need to determine and analyze your company's performance over the last month using the data provided. Prompt Use the information in the Milestone Three Actual Costs and Revenue Data Appendix to evaluate your company's performance, and complete the remaining tabs in the Project Workbook that you used for the Milestone One and Two assignments. Specifically, you must address the following rubric criteria: • Statement of Cost of Goods Sold: Prepare the statement of cost of goods sold in the "COGS" tab of the workbook. Remember to show your work using calculations to the side of the table or using appropriate formulas in the table. • Income Statement: Use the given revenue data to prepare the "Income Statement" tab table and calculate the net income. Remember to show your work using calculations to the side of the table or using appropriate formulas in the table. • Variance Analysis: Prepare the data in the "Variances" tab to determine whether the variances are favorable or unfavorable. Remember to show your work using calculations to the side of the table or using appropriate formulas in the table. - Complete the data table for the variances by entering the budgeted (standard) and actual labor and material values. Remember to use the estimates for expected sales from your Milestone Two assignment. > Determine the variances for direct labor and direct materials in the "Variances" tab. + Evaluate the significance of the variances in the "Variances" tab, and mark them as favorable or unfavorable. Guidelines for Submission Submit the Project Workbook with all tabs completed. This file should be completed and submitted using Microsoft Excel. For your statement of cost of goods sold, use the following data regarding the actual costs incurred by the business over the past month: . . ● Overhead costs: $3,765 Note: Assume that the beginning materials and ending work in process are zero for the month. Use the following revenue and cost information for the income statement. Note that the revenue you use will depend on the pricing level options you chose in Milestone Two. Also, assume that after accounting for weekends and other holidays, there were 20 business days in the first month of operation. For example, if you chose a sales price of $20 per collar, the actual number of collars sold in the month was 33 per day or 33 x 20 = 660 per month. Established Sales Price Collars $20 $24 $28 Leashes $22 $26 $30 Harnesses $25 $30 $35 Materials purchased: $20,000 o Consumed 80% of the purchased materials Direct labor: $8,493.33 . . . . The other costs incurred by the business include: General and administrative salaries o Receptionist: $1,950 O Owner salary: $500 . · Number of Items Sold per Day 33 28 23 28 23 18. 25 22 20 Depreciation: $165 Rent: $750 Utilities and insurance: $600 Scissors, thread, and cording: $1,200 Loan repayment: $550 Variance At the end of the month, you find that the labor and materials spent on manufacturing collars was different from what you estimated: • The collar maker had to work nine hours a day instead of eight due to an increased demand for collars. Because of the increased demand, the hourly rate you paid your employee for making the collars increased to $16.50. ● . • An increase in the cost of raw material led the direct material cost per collar to increase to $10. However, you also made and sold 60 more collars than you expected to sell in the month. You now need to determine the variance in the materials and labor cost from what you estimated in Milestone Two based on the market research data. 1 2 Milestone Three - Statement of Cost of Goods Sold 3 4 6 Beginning Work in Process Inventory 7 Direct Materials: 8 9 11 12 A Materials: Beginning Add: Purchases for month of January 14 15 16 Direct Labor 17 Overhead 24 25 26 Materials available for use Deduct: Ending materials Materials Used 19 Total Costs 20 21 Deduct: Ending Work in Process Inventory 22 23 Cost of Goods Sold 565 B CASTAM 0 C 0 III D 2 Milestone Three - Income Statement 3 4 5 6 7 8 9 10 Total Revenue: 11 Cost of goods sold 12 Gross profit 13. 222 Revenue: 14 Expenses: 15 16 17 18 19 21 Collars Leashes Harnesses 222 20 Loan General and administrative salaries Depreciation 22 Total Expenses 23 27 29 30 31 32 A Rent Utilities and insurance Scissors, thread, and cording 24 Net Income/Loss $ $ B S $ S $ 1 2 Milestone Three - Variance Analysis 3 4 5 Data for Variance Analysis: 6789 8 Labor 10 11 Materials. 0123 A 12 13 14 15 Variances for Collar Sales B 28 29 30 Budgeted (Standard) Hours/Qty 16 17 Direct Labor Time Variance 18 19 20 Direct Labor Rate Variance 21 22 23 Direct Materials Quantity/Efficiency Variance 24 25 26 Direct Materials Price Variance 27 (Actual Hours - Standard Hours) x Standard Rate (Actual Rate - Standard Rate) x Actual Hours Budgeted (Standard) Rate (Actual Quantity - Standard Quantity) x Standard Price (Actual Price - Standard Price) x Actual Quantity $ D Actual Hours/Qty Variance Actual Rate Favorable/ Unfavorable Milestone Three Guidelines and Rubric ✓ Listen Scenario It has now been one month since you launched your business. You are meeting with a few investors soon to share your vision for the company and to ask for more funding. You will be sharing your company's financial health at this meeting. To do that, you need to determine and analyze your company's performance over the last month using the data provided. Prompt Use the information in the Milestone Three Actual Costs and Revenue Data Appendix to evaluate your company's performance, and complete the remaining tabs in the Project Workbook that you used for the Milestone One and Two assignments. Specifically, you must address the following rubric criteria: • Statement of Cost of Goods Sold: Prepare the statement of cost of goods sold in the "COGS" tab of the workbook. Remember to show your work using calculations to the side of the table or using appropriate formulas in the table. • Income Statement: Use the given revenue data to prepare the "Income Statement" tab table and calculate the net income. Remember to show your work using calculations to the side of the table or using appropriate formulas in the table. • Variance Analysis: Prepare the data in the "Variances" tab to determine whether the variances are favorable or unfavorable. Remember to show your work using calculations to the side of the table or using appropriate formulas in the table. - Complete the data table for the variances by entering the budgeted (standard) and actual labor and material values. Remember to use the estimates for expected sales from your Milestone Two assignment. > Determine the variances for direct labor and direct materials in the "Variances" tab. + Evaluate the significance of the variances in the "Variances" tab, and mark them as favorable or unfavorable. Guidelines for Submission Submit the Project Workbook with all tabs completed. This file should be completed and submitted using Microsoft Excel. For your statement of cost of goods sold, use the following data regarding the actual costs incurred by the business over the past month: . . ● Overhead costs: $3,765 Note: Assume that the beginning materials and ending work in process are zero for the month. Use the following revenue and cost information for the income statement. Note that the revenue you use will depend on the pricing level options you chose in Milestone Two. Also, assume that after accounting for weekends and other holidays, there were 20 business days in the first month of operation. For example, if you chose a sales price of $20 per collar, the actual number of collars sold in the month was 33 per day or 33 x 20 = 660 per month. Established Sales Price Collars $20 $24 $28 Leashes $22 $26 $30 Harnesses $25 $30 $35 Materials purchased: $20,000 o Consumed 80% of the purchased materials Direct labor: $8,493.33 . . . . The other costs incurred by the business include: General and administrative salaries o Receptionist: $1,950 O Owner salary: $500 . · Number of Items Sold per Day 33 28 23 28 23 18. 25 22 20 Depreciation: $165 Rent: $750 Utilities and insurance: $600 Scissors, thread, and cording: $1,200 Loan repayment: $550 Variance At the end of the month, you find that the labor and materials spent on manufacturing collars was different from what you estimated: • The collar maker had to work nine hours a day instead of eight due to an increased demand for collars. Because of the increased demand, the hourly rate you paid your employee for making the collars increased to $16.50. ● . • An increase in the cost of raw material led the direct material cost per collar to increase to $10. However, you also made and sold 60 more collars than you expected to sell in the month. You now need to determine the variance in the materials and labor cost from what you estimated in Milestone Two based on the market research data. 1 2 Milestone Three - Statement of Cost of Goods Sold 3 4 6 Beginning Work in Process Inventory 7 Direct Materials: 8 9 11 12 A Materials: Beginning Add: Purchases for month of January 14 15 16 Direct Labor 17 Overhead 24 25 26 Materials available for use Deduct: Ending materials Materials Used 19 Total Costs 20 21 Deduct: Ending Work in Process Inventory 22 23 Cost of Goods Sold 565 B CASTAM 0 C 0 III D 2 Milestone Three - Income Statement 3 4 5 6 7 8 9 10 Total Revenue: 11 Cost of goods sold 12 Gross profit 13. 222 Revenue: 14 Expenses: 15 16 17 18 19 21 Collars Leashes Harnesses 222 20 Loan General and administrative salaries Depreciation 22 Total Expenses 23 27 29 30 31 32 A Rent Utilities and insurance Scissors, thread, and cording 24 Net Income/Loss $ $ B S $ S $ 1 2 Milestone Three - Variance Analysis 3 4 5 Data for Variance Analysis: 6789 8 Labor 10 11 Materials. 0123 A 12 13 14 15 Variances for Collar Sales B 28 29 30 Budgeted (Standard) Hours/Qty 16 17 Direct Labor Time Variance 18 19 20 Direct Labor Rate Variance 21 22 23 Direct Materials Quantity/Efficiency Variance 24 25 26 Direct Materials Price Variance 27 (Actual Hours - Standard Hours) x Standard Rate (Actual Rate - Standard Rate) x Actual Hours Budgeted (Standard) Rate (Actual Quantity - Standard Quantity) x Standard Price (Actual Price - Standard Price) x Actual Quantity $ D Actual Hours/Qty Variance Actual Rate Favorable/ Unfavorable Milestone Three Guidelines and Rubric ✓ Listen Scenario It has now been one month since you launched your business. You are meeting with a few investors soon to share your vision for the company and to ask for more funding. You will be sharing your company's financial health at this meeting. To do that, you need to determine and analyze your company's performance over the last month using the data provided. Prompt Use the information in the Milestone Three Actual Costs and Revenue Data Appendix to evaluate your company's performance, and complete the remaining tabs in the Project Workbook that you used for the Milestone One and Two assignments. Specifically, you must address the following rubric criteria: • Statement of Cost of Goods Sold: Prepare the statement of cost of goods sold in the "COGS" tab of the workbook. Remember to show your work using calculations to the side of the table or using appropriate formulas in the table. • Income Statement: Use the given revenue data to prepare the "Income Statement" tab table and calculate the net income. Remember to show your work using calculations to the side of the table or using appropriate formulas in the table. • Variance Analysis: Prepare the data in the "Variances" tab to determine whether the variances are favorable or unfavorable. Remember to show your work using calculations to the side of the table or using appropriate formulas in the table. - Complete the data table for the variances by entering the budgeted (standard) and actual labor and material values. Remember to use the estimates for expected sales from your Milestone Two assignment. > Determine the variances for direct labor and direct materials in the "Variances" tab. + Evaluate the significance of the variances in the "Variances" tab, and mark them as favorable or unfavorable. Guidelines for Submission Submit the Project Workbook with all tabs completed. This file should be completed and submitted using Microsoft Excel. For your statement of cost of goods sold, use the following data regarding the actual costs incurred by the business over the past month: . . ● Overhead costs: $3,765 Note: Assume that the beginning materials and ending work in process are zero for the month. Use the following revenue and cost information for the income statement. Note that the revenue you use will depend on the pricing level options you chose in Milestone Two. Also, assume that after accounting for weekends and other holidays, there were 20 business days in the first month of operation. For example, if you chose a sales price of $20 per collar, the actual number of collars sold in the month was 33 per day or 33 x 20 = 660 per month. Established Sales Price Collars $20 $24 $28 Leashes $22 $26 $30 Harnesses $25 $30 $35 Materials purchased: $20,000 o Consumed 80% of the purchased materials Direct labor: $8,493.33 . . . . The other costs incurred by the business include: General and administrative salaries o Receptionist: $1,950 O Owner salary: $500 . · Number of Items Sold per Day 33 28 23 28 23 18. 25 22 20 Depreciation: $165 Rent: $750 Utilities and insurance: $600 Scissors, thread, and cording: $1,200 Loan repayment: $550 Variance At the end of the month, you find that the labor and materials spent on manufacturing collars was different from what you estimated: • The collar maker had to work nine hours a day instead of eight due to an increased demand for collars. Because of the increased demand, the hourly rate you paid your employee for making the collars increased to $16.50. ● . • An increase in the cost of raw material led the direct material cost per collar to increase to $10. However, you also made and sold 60 more collars than you expected to sell in the month. You now need to determine the variance in the materials and labor cost from what you estimated in Milestone Two based on the market research data.
Expert Answer:
Answer rating: 100% (QA)
Milestone Three Statement of Cost of Goods Sold Beginning Work in Process Inventory 0 Direct Materials Materials Beginning 0 Add purchased material 20000 Deduct Ending materials 4000 Materials Used 16... View the full answer

Related Book For 

Managerial Accounting
ISBN: 978-1259307416
16th edition
Authors: Ray Garrison, Eric Noreen, Peter Brewer
Posted Date:
Students also viewed these accounting questions
-
A company has the following work in process inventory information: 6,000 units were in beginning inventory. 12,000 units were started. 5,000 units were in ending inventory. Beginning inventory is...
-
Prepare the Budgeted Statement of Cost of Goods Sold for October 2020. Prepare the Budgeted Income Statement for October 2020 Prepare the Cash Budget for October 2020. Prepare a budgeted balance...
-
A company reports ending work in process inventory of $770 and cost of goods sold of $23,404. Compute days sales in work in process inventory. Round the answer to the nearest whole day.
-
The probability that fewer than 35 people support theprivatization of Social Security A discrete random variable is given. Assume the probability of the random variable will be approximated using the...
-
R B Company began June with inventory of $45,800. The business made net purchases of $31,900 and had net sales of $64,500 before a fire destroyed the companys inventory. For the past several years, R...
-
Talbot Industries is considering launching a new product. The new manufacturing equipment will cost $17 million, and production and sales will require an initial $5 million investment in net...
-
For each of the following situations, calculate the degrees of freedom \((d f)\), identify the critical values (assume \(\mathrm{a}=.05\) [two-tailed]), calculate the \(t\)-statistic \((t)\), make a...
-
Wanda is a 20 percent owner of Video Associates, which is treated as a pass through entity for federal income tax purposes. This year, Wanda was allocated $45,000 of ordinary income from Video...
-
How will the Dodd-Frank Act affect value of structured instruments to both originator and issuer? Would it affect their usefulness as a source of financing and diversification/transfer of credit...
-
This comprehensive review problem requires you to complete the accounting cycle for Sherman Realty twice. This practice set allows you to review Chapters 1-5 while reinforcing the relationships...
-
In proving revenue, a company may want to be book revenue high. What is persuasive evidence that a revenue arrangement does not exist?
-
Write a program that displays the properties of a letter-size (8.5 11 inches) sheet of paper in millimeters. There are 25.4 millimeters per inch. The program should print: The width and height The...
-
Develop a set of test cases for the algorithm in Exercise P5.1. Data from Exercise P 5.1 The following algorithm yields the season (Spring, Summer, Fall, or Winter) for a given month and day. If...
-
Suppose you want to implement a class TimeDepositAccount. A time deposit account has a fixed interest rate that should be set in the constructor, together with the initial balance. Provide a method...
-
We want to observe the following calculation Arrays a, b, c, and d memory layout is displayed below (each has 512 4-byte-wide integer elements). The above calculation employs a for loop that runs...
-
Print an X shape in a box of a given side length, like this:
-
The figure below is a stock-and-flow diagram. inflow stock outflow * Explain the meaning of all graphical elements (stock, flows, valves, source and sink) that constitute this stock-and-flow diagram.
-
President Lee Coone has asked you to continue planning for an integrated corporate NDAS network. Ultimately, this network will link all the offices with the Tampa head office and become the...
-
Bunnell Corporation is a manufacturer that uses job-order costing. On January 1, the company's inventory balances were as follows: Raw materials............................$40,000 Work in...
-
What guideline should be used in determining whether a joint product should be sold at the split-off point or processed further?
-
Delta Company produces a single product. The cost of producing and selling a single unit of this product at the company's normal activity level of 60,000 units per year is: Direct materials . . . . ....
-
Define and distinguish between an open and a closed adoption.
-
Define and distinguish between an independent and an agency adoption.
-
Define and give an example of an equitable adoption.

Study smarter with the SolutionInn App