

*1. A key factor in the world's economic condition is the population growth of regions. The...
Fantastic news! We've Found the answer you've been seeking!
Question:
Transcribed Image Text:
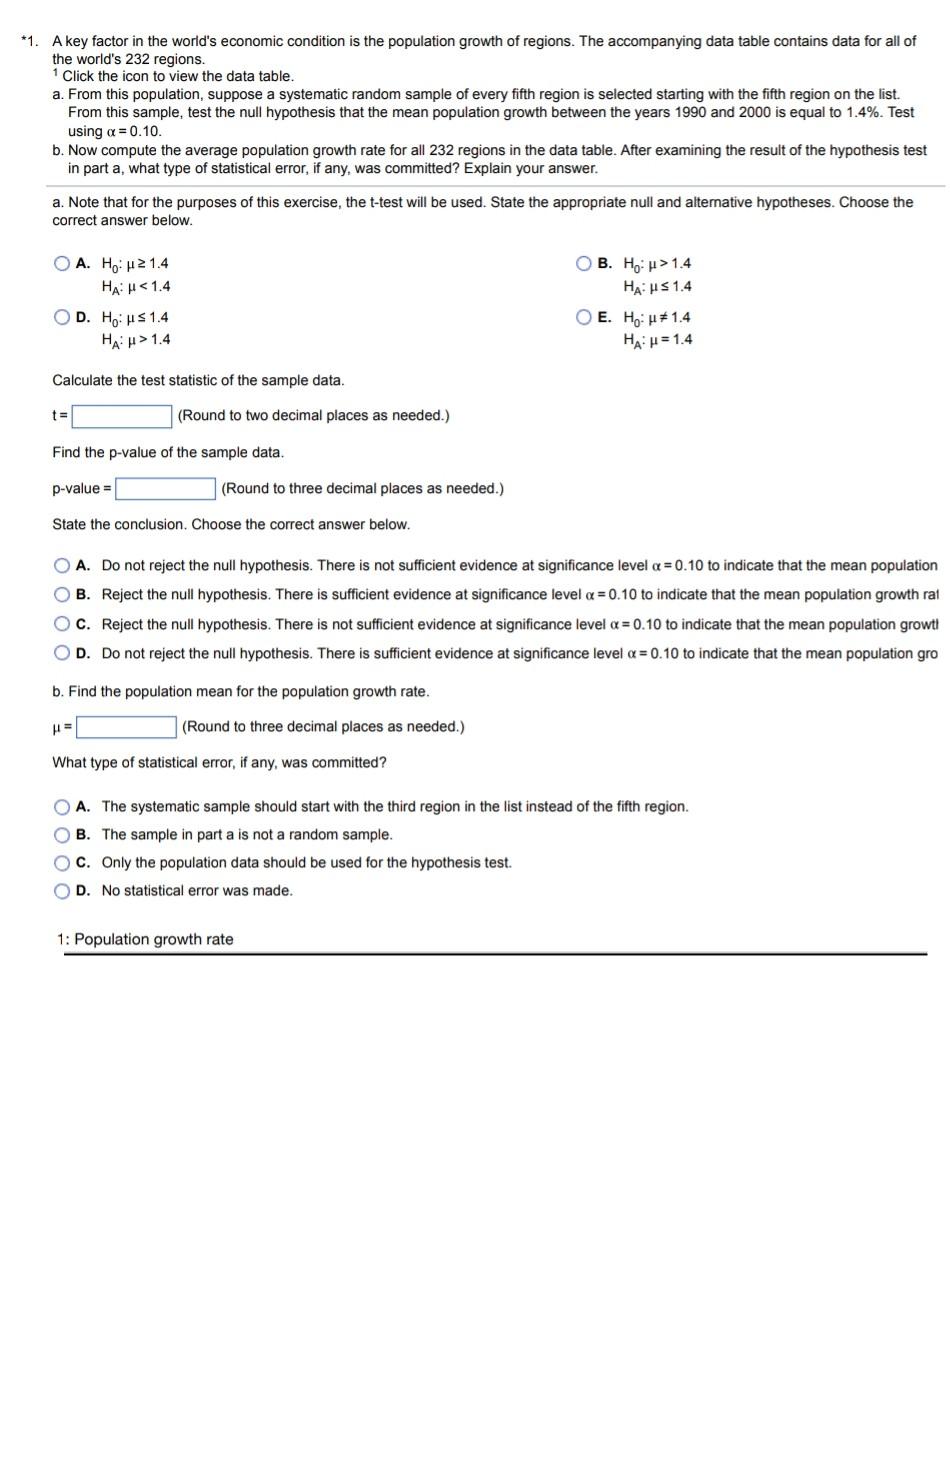
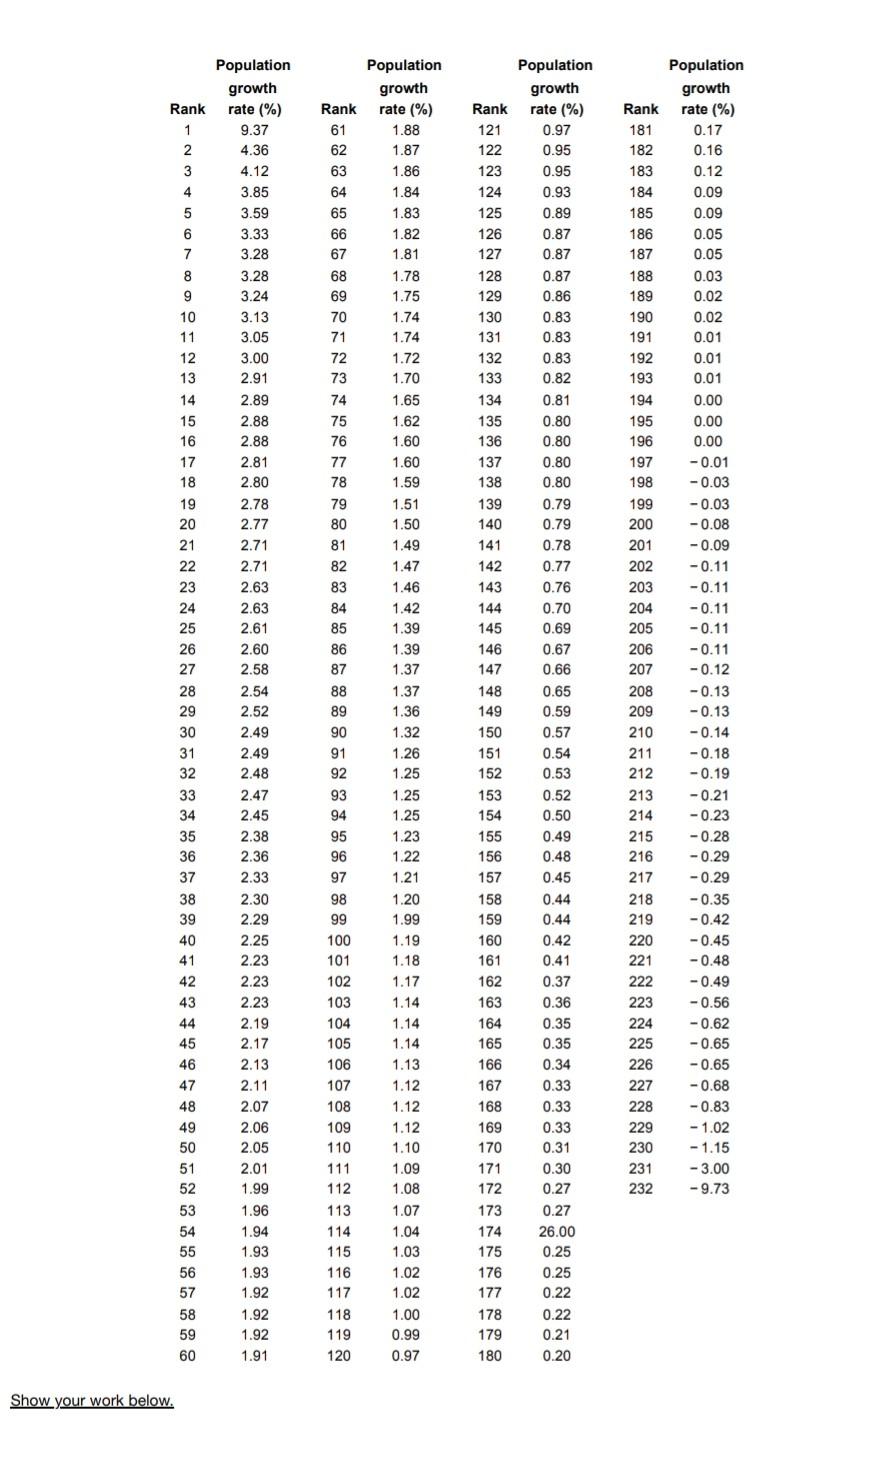
*1. A key factor in the world's economic condition is the population growth of regions. The accompanying data table contains data for all of the world's 232 regions. 1 Click the icon to view the data table. a. From this population, suppose a systematic random sample of every fifth region is selected starting with the fifth region on the list. From this sample, test the null hypothesis that the mean population growth between the years 1990 and 2000 is equal to 1.4%. Test using a = 0.10. b. Now compute the average population growth rate for all 232 regions in the data table. After examining the result of the hypothesis test in part a, what type of statistical error, if any, was committed? Explain your answer. a. Note that for the purposes of this exercise, the t-test will be used. State the appropriate null and alternative hypotheses. Choose the correct answer below. A. Ho: 21.4 HA: H<1.4 OD. Ho: H≤ 1.4 HA: H>1.4 Calculate the test statistic of the sample data. t= (Round to two decimal places as needed.) Find the p-value of the sample data. p-value= (Round to three decimal places as needed.) State the conclusion. Choose the correct answer below. B. Ho: >1.4 HA: H≤ 1.4 O E. Ho: #1.4 HA: H=1.4 OA. Do not reject the null hypothesis. There is not sufficient evidence at significance level a=0.10 to indicate that the mean population OB. Reject the null hypothesis. There is sufficient evidence at significance level α= 0.10 to indicate that the mean population growth rat OC. Reject the null hypothesis. There is not sufficient evidence at significance level = 0.10 to indicate that the mean population growt! O D. Do not reject the null hypothesis. There is sufficient evidence at significance level = 0.10 to indicate that the mean population gro b. Find the population mean for the population growth rate. μ= (Round to three decimal places as needed.) What type of statistical error, if any, was committed? 1: Population growth rate OA. The systematic sample should start with the third region in the list instead of the fifth region. OB. The sample in part a is not a random sample. OC. Only the population data should be used for the hypothesis test. OD. No statistical error was made. Rank 1 2 3 Show your work below. 4 5 6 7 8 9 10 11 12 13 14 15 16 17 18 19 20 21 22 23 24 25 26 27 28 29 30 31 32 33 34 35 36 37 38 39 40 41 42 43 44 45 46 47 48 49 50 51 52 53 54 55 56 57 58 59 60 Population growth rate (%) 9.37 4.36 4.12 3.85 3.59 3.33 3.28 3.28 3.24 3.13 3.05 3.00 2.91 2.89 2.88 2.88 2.81 2.80 2.78 2.77 2.71 2.71 2.63 2.63 2.61 2.60 2.58 2.54 2.52 2.49 2.49 2.48 2.47 2.45 2.38 2.36 2.33 2.30 2.29 2.25 2.23 2.23 2.23 2.19 2.17 2.13 2.11 2.07 2.06 2.05 2.01 1.99 1.96 1.94 1.93 1.93 1.92 1.92 1.92 1.91 Rank 61 62 63 64 65 66 67 68 69 70 71 72 73 HERRER SE 74 75 76 77 78 79 80 81 82 83 84 85 86 87 88 89 90 91 92 93 94 95 96 97 98 99 100 101 102 103 104 105 106 107 108 109 110 111 112 113 114 115 116 117 118 119 120 Population growth rate (%) 1.88 1.87 1.86 1.84 1.83 1.82 1.81 1.78 1.75 1.74 1.74 1.72 1.70 1.65 1.62 1.60 1.60 1.59 1.51 1.50 1.49 1.47 1.46 1.42 1.39 1.39 1.37 1.37 1.36 1.32 1.26 1.25 1.25 1.25 1.23 1.22 1.21 1.20 1.99 1.19 1.18 1.17 1.14 1.14 1.14 1.13 1.12 1.12 1.12 1.10 1.09 1.08 1.07 1.04 1.03 1.02 1.02 1.00 0.99 0.97 Rank 121 122 123 124 125 126 127 128 129 130 131 132 133 134 135 136 137 138 139 140 141 142 143 144 145 146 147 148 149 150 151 152 153 154 155 156 157 158 159 160 161 162 163 164 165 166 167 168 169 170 171 172 173 174 175 176 177 178 179 180 Population growth rate (%) 0.97 0.95 0.95 0.93 0.89 0.87 0.87 0.87 0.86 0.83 0.83 0.83 0.82 0.81 0.80 0.80 0.80 0.80 0.79 0.79 0.78 0.77 0.76 0.70 0.69 0.67 0.66 0.65 0.59 0.57 0.54 0.53 0.52 0.50 0.49 0.48 0.45 0.44 0.44 0.42 0.41 0.37 0.36 0.35 0.35 0.34 0.33 0.33 0.33 0.31 0.30 0.27 0.27 26.00 0.25 0.25 0.22 0.22 0.21 0.20 Rank 181 182 183 184 185 186 187 188 189 190 191 192 193 194 195 196 197 198 213 214 215 216 217 218 219 220 221 222 223 Population growth rate (%) 199 -0.03 200 -0.08 201 -0.09 202 -0.11 203 -0.11 204 -0.11 205 -0.11 206 -0.11 207 -0.12 208 -0.13 209 -0.13 210 -0.14 211 -0.18 212 -0.19 -0.21 -0.23 -0.28 -0.29 -0.29 -0.35 -0.42 -0.45 -0.48 -0.49 -0.56 -0.62 -0.65 -0.65 -0.68 -0.83 - 1.02 -1.15 - 3.00 -9.73 224 225 226 227 228 229 230 231 232 0.17 0.16 0.12 0.09 0.09 0.05 0.05 0.03 0.02 0.02 0.01 0.01 0.01 0.00 0.00 0.00 -0.01 -0.03 *1. A key factor in the world's economic condition is the population growth of regions. The accompanying data table contains data for all of the world's 232 regions. 1 Click the icon to view the data table. a. From this population, suppose a systematic random sample of every fifth region is selected starting with the fifth region on the list. From this sample, test the null hypothesis that the mean population growth between the years 1990 and 2000 is equal to 1.4%. Test using a = 0.10. b. Now compute the average population growth rate for all 232 regions in the data table. After examining the result of the hypothesis test in part a, what type of statistical error, if any, was committed? Explain your answer. a. Note that for the purposes of this exercise, the t-test will be used. State the appropriate null and alternative hypotheses. Choose the correct answer below. A. Ho: 21.4 HA: H<1.4 OD. Ho: H≤ 1.4 HA: H>1.4 Calculate the test statistic of the sample data. t= (Round to two decimal places as needed.) Find the p-value of the sample data. p-value= (Round to three decimal places as needed.) State the conclusion. Choose the correct answer below. B. Ho: >1.4 HA: H≤ 1.4 O E. Ho: #1.4 HA: H=1.4 OA. Do not reject the null hypothesis. There is not sufficient evidence at significance level a=0.10 to indicate that the mean population OB. Reject the null hypothesis. There is sufficient evidence at significance level α= 0.10 to indicate that the mean population growth rat OC. Reject the null hypothesis. There is not sufficient evidence at significance level = 0.10 to indicate that the mean population growt! O D. Do not reject the null hypothesis. There is sufficient evidence at significance level = 0.10 to indicate that the mean population gro b. Find the population mean for the population growth rate. μ= (Round to three decimal places as needed.) What type of statistical error, if any, was committed? 1: Population growth rate OA. The systematic sample should start with the third region in the list instead of the fifth region. OB. The sample in part a is not a random sample. OC. Only the population data should be used for the hypothesis test. OD. No statistical error was made. Rank 1 2 3 Show your work below. 4 5 6 7 8 9 10 11 12 13 14 15 16 17 18 19 20 21 22 23 24 25 26 27 28 29 30 31 32 33 34 35 36 37 38 39 40 41 42 43 44 45 46 47 48 49 50 51 52 53 54 55 56 57 58 59 60 Population growth rate (%) 9.37 4.36 4.12 3.85 3.59 3.33 3.28 3.28 3.24 3.13 3.05 3.00 2.91 2.89 2.88 2.88 2.81 2.80 2.78 2.77 2.71 2.71 2.63 2.63 2.61 2.60 2.58 2.54 2.52 2.49 2.49 2.48 2.47 2.45 2.38 2.36 2.33 2.30 2.29 2.25 2.23 2.23 2.23 2.19 2.17 2.13 2.11 2.07 2.06 2.05 2.01 1.99 1.96 1.94 1.93 1.93 1.92 1.92 1.92 1.91 Rank 61 62 63 64 65 66 67 68 69 70 71 72 73 HERRER SE 74 75 76 77 78 79 80 81 82 83 84 85 86 87 88 89 90 91 92 93 94 95 96 97 98 99 100 101 102 103 104 105 106 107 108 109 110 111 112 113 114 115 116 117 118 119 120 Population growth rate (%) 1.88 1.87 1.86 1.84 1.83 1.82 1.81 1.78 1.75 1.74 1.74 1.72 1.70 1.65 1.62 1.60 1.60 1.59 1.51 1.50 1.49 1.47 1.46 1.42 1.39 1.39 1.37 1.37 1.36 1.32 1.26 1.25 1.25 1.25 1.23 1.22 1.21 1.20 1.99 1.19 1.18 1.17 1.14 1.14 1.14 1.13 1.12 1.12 1.12 1.10 1.09 1.08 1.07 1.04 1.03 1.02 1.02 1.00 0.99 0.97 Rank 121 122 123 124 125 126 127 128 129 130 131 132 133 134 135 136 137 138 139 140 141 142 143 144 145 146 147 148 149 150 151 152 153 154 155 156 157 158 159 160 161 162 163 164 165 166 167 168 169 170 171 172 173 174 175 176 177 178 179 180 Population growth rate (%) 0.97 0.95 0.95 0.93 0.89 0.87 0.87 0.87 0.86 0.83 0.83 0.83 0.82 0.81 0.80 0.80 0.80 0.80 0.79 0.79 0.78 0.77 0.76 0.70 0.69 0.67 0.66 0.65 0.59 0.57 0.54 0.53 0.52 0.50 0.49 0.48 0.45 0.44 0.44 0.42 0.41 0.37 0.36 0.35 0.35 0.34 0.33 0.33 0.33 0.31 0.30 0.27 0.27 26.00 0.25 0.25 0.22 0.22 0.21 0.20 Rank 181 182 183 184 185 186 187 188 189 190 191 192 193 194 195 196 197 198 213 214 215 216 217 218 219 220 221 222 223 Population growth rate (%) 199 -0.03 200 -0.08 201 -0.09 202 -0.11 203 -0.11 204 -0.11 205 -0.11 206 -0.11 207 -0.12 208 -0.13 209 -0.13 210 -0.14 211 -0.18 212 -0.19 -0.21 -0.23 -0.28 -0.29 -0.29 -0.35 -0.42 -0.45 -0.48 -0.49 -0.56 -0.62 -0.65 -0.65 -0.68 -0.83 - 1.02 -1.15 - 3.00 -9.73 224 225 226 227 228 229 230 231 232 0.17 0.16 0.12 0.09 0.09 0.05 0.05 0.03 0.02 0.02 0.01 0.01 0.01 0.00 0.00 0.00 -0.01 -0.03
Expert Answer:
Answer rating: 100% (QA)
The detailed answer for the above question is provided below Ans 1 For part a the c... View the full answer

Related Book For 

Business Statistics A Decision Making Approach
ISBN: 9780133021844
9th Edition
Authors: David F. Groebner, Patrick W. Shannon, Phillip C. Fry
Posted Date:
Students also viewed these mathematics questions
-
A key factor in the worlds economic condition is the population growth of the countries in the world. The file called Country Growth contains data for 231 countries. Consider these countries to be...
-
In 1957, Procter & Gamble acquired Green Bay, Wisconsin-based tissue maker Charmin, its first consumer-paper products business. One product in particular, Charmin Towels, was a single-ply towel that...
-
In June of 2014, Bill Madden considered expanding his micro tiles business. He planned to invest $2.0 million in 2016 to produce more and better quality plaster or metal tiles and lithographs. These...
-
In May 2020 Bernard, a self-employed plumber, and his son Gerald, a self-employed electrician, purchased 1,000 empty barrels from a Scottish whisky distillery. The barrels were over 100 years old and...
-
A gas mixture at 300 K and 200 kPa consists of 1 kg of CO2 and 3 kg of CH4. Determine the partial pressure of each gas and the apparent molar mass of the gas mixture.
-
Explain the risk and rewards to a company that result from having fixed costs.
-
A FedEx airplane costs $50 million and is expected to fly 500 million miles during its 10-year life. Residual value is expected to be zero because the plane was used when acquired. If the plane...
-
Nuke-It-Now manufactures microwave ovens. The following represents the financial information from one of its manufacturing plants for two years. Required a. Classify these items into prevention (P),...
-
6: What is a superannuation guarantee charge (not to be confused with just the Superannuation Guarantee)? Hint: Search ATO website for "superannuation guarantee charge
-
A process is in control with x = 100.s = 1.05, and n = 5. The process specifications are at 95 ± 10. The quality characteristic has a normal distribution. (a) Estimate the potential...
-
Polygon Corporation is preparing earnings per share data for 2020. The net income for the year ended December 31, 2020, was $200,000 and there were 30,000 common shares outstanding during the entire...
-
The low-cost airline business is often cited as an example of a highly contestable market. To what extent do the assumptions of a perfectly contestable market apply to the low-cost airline industry...
-
One of the important changes in the world economy over the past three decades has been the rapid increase in capital investment in the countries of the Pacific Basin (notably Japan and Korea). What...
-
Australia is land abundant, and India is labor abundant. Wheat is land intensive relative to textiles. Graphically demonstrate the pre trade and post trade equilibria between these two countries....
-
Internet service providers (ISPs) have been cited as an example of an industry that exhibits features of contestability. Consider some of the potential costs of entering such an industry and comment...
-
Why might we want to think about market price as the outcome of a bargaining model?
-
Assume you are a manager of Blizzard (a computer game company) and you are considering the launch of a new game "StarCraft 4" (let SC4). You have sent out an RFP (request for proposal) to third-party...
-
On January 1, 2018, Khalid Ltd., which follows IAS 17, entered into an eight-year lease agreement for three dryers. Annual lease payments for the equipment are $28,500 at the beginning of each lease...
-
Explain under what circumstances you would use hypothesis testing as opposed to an estimation procedure.
-
The economic downturn after the financial crisis early in the current century affected all salaried employees, certainly starting MBA employees. While the average starting salary varies depending on...
-
Solve for beta when the true population mean is 103 and the following information is given: Ho: -s 100 HA: > 100 -0.05 n 49
-
Weights, in pounds, of a sample of male college soccer players were measured. The following display from a TI-84 Plus calculator presents a 98% confidence interval for the population mean weight. a....
-
A sample of used cars on a lot was taken, and the age of each car was recorded. The following MINITAB output presents a confidence interval for the population mean age. a. How many degrees of freedom...
-
A sample of college students was asked how many hours per week they spent reading. The following display from a TI-84 Plus calculator presents a 95% confidence interval for the population mean time...

Study smarter with the SolutionInn App