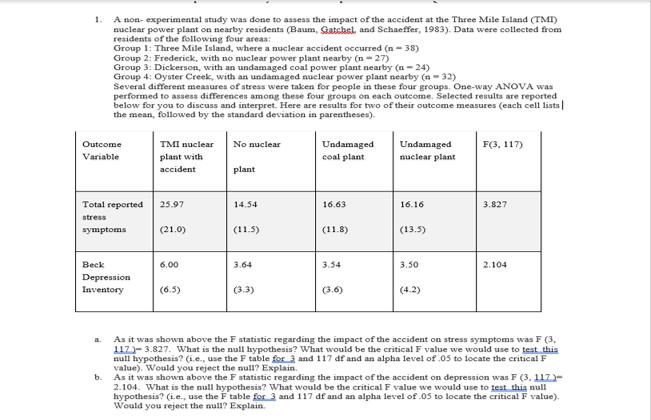
1. A non- experimental study was done to asseas the impact of the accident at the...
Fantastic news! We've Found the answer you've been seeking!
Question:
Transcribed Image Text:
1. A non- experimental study was done to asseas the impact of the accident at the Three Mile Island (TMI) nuclear power plant on nearby residents (Baum, Gatchel, and Schaeffer, 1983). Data were collected from residents of the following four areas: Group 1: Three Mile Island, where a nuclear accident occurred (n - 38) Group 2: Frederick, with no nuclear power plant nearby (n- 27) Group 3: Dickerson, with an undamaged coal power plant nearby (a - 24) Group 4: Oyster Creek, with an undamaged nuclear power plant nearby (n- 32) Several different measures of stress were taken for people in these four groups. One-way ANOVA was performed to assess differences among these four groups on each outcome. Selected results are reported below for you to discuss and interpret. Here are results for two of their outcome measures (each cell lists| the mean, followed by the standard deviation in parentheses). Undamaged F(3, 117) Outcome TMI nuclear No nuclear Undamaged Variable plant with coal plant nuclear plant accident plant Total reported 25.97 14.54 16.63 16.16 3.827 stress symptoms (21.0) (11.5) (11.8) (13.5) Beck 6.00 3.64 3.54 3.50 2.104 Depression Inventory (6.5) (3.3) (3.6) (4.2) a. As it was shown above the F statistic regarding the impact of the accident on stress symptoms was F (3, 117)- 3.827. What is the null hypothesis? What would be the critical F value we would use to test this null hypothesis? (i.e., use the F table for 3 and 117 df and an alpha level of .05 to locate the critical F value). Would you reject the null? Explain. b. As it was shown above the F statistic regarding the impact of the accident on depression was F (3, 117- 2.104. What is the null hypothesis? What would be the critical F value we would use to test thia null hypothesis? (i.e., use the F table for 3 and 117 df and an alpha level of .05 to locate the critical F value). Would you rejecet the null? Explain. 1. A non- experimental study was done to asseas the impact of the accident at the Three Mile Island (TMI) nuclear power plant on nearby residents (Baum, Gatchel, and Schaeffer, 1983). Data were collected from residents of the following four areas: Group 1: Three Mile Island, where a nuclear accident occurred (n - 38) Group 2: Frederick, with no nuclear power plant nearby (n- 27) Group 3: Dickerson, with an undamaged coal power plant nearby (a - 24) Group 4: Oyster Creek, with an undamaged nuclear power plant nearby (n- 32) Several different measures of stress were taken for people in these four groups. One-way ANOVA was performed to assess differences among these four groups on each outcome. Selected results are reported below for you to discuss and interpret. Here are results for two of their outcome measures (each cell lists| the mean, followed by the standard deviation in parentheses). Undamaged F(3, 117) Outcome TMI nuclear No nuclear Undamaged Variable plant with coal plant nuclear plant accident plant Total reported 25.97 14.54 16.63 16.16 3.827 stress symptoms (21.0) (11.5) (11.8) (13.5) Beck 6.00 3.64 3.54 3.50 2.104 Depression Inventory (6.5) (3.3) (3.6) (4.2) a. As it was shown above the F statistic regarding the impact of the accident on stress symptoms was F (3, 117)- 3.827. What is the null hypothesis? What would be the critical F value we would use to test this null hypothesis? (i.e., use the F table for 3 and 117 df and an alpha level of .05 to locate the critical F value). Would you reject the null? Explain. b. As it was shown above the F statistic regarding the impact of the accident on depression was F (3, 117- 2.104. What is the null hypothesis? What would be the critical F value we would use to test thia null hypothesis? (i.e., use the F table for 3 and 117 df and an alpha level of .05 to locate the critical F value). Would you rejecet the null? Explain.
Expert Answer:
Answer rating: 100% (QA)
1 We are given the following information and please answer the following questions Outcome Variable ... View the full answer
Related Book For
Applied Statistics From Bivariate Through Multivariate Techniques
ISBN: 978-1412991346
2nd edition
Authors: Rebecca M. Warner
Posted Date:
Students also viewed these accounting questions
-
The following data were collected from a standard 0.505-in.-diameter test specimen of a copper alloy (l0 = 2.0 in.): After fracture, the total length was 3.014 in., and the diameter was 0.374 in....
-
The following data were collected from a cell concentration sensor measuring absorbance in a biochemical stream. The input u is the flow rate deviation (in dimensionless units) and the sensor output...
-
The following data were collected from a cohort study that examined a possible association between prior pregnancy and ovarian cancer in a high-risk group of women. pregnancy ovarian cancer Yes No...
-
Which of the following is not an example of supervised machine learning? O Clustering O Deep learning O Decision Tree Linear Regression
-
The file S02_07.xlsx includes data on 204 employees at the (fictional) company Beta Technologies. a. Create a table of correlations between the variables Age, Prior Experience, Beta Experience,...
-
An electronic PID temperature controller is at steady state with an output of 12 mA. The set point equals the nominal process temperature initially. At t = 0, the error signal is increased at the...
-
Recently you read an article regarding a new product introduced late last year by 5G Inc., a consumer products company. The article's author, although praising \(5 \mathrm{G}\) Inc. for providing the...
-
Montevideo Manufacturing, Inc. produces a single type of small motor. The bookkeeper who does not have an in-depth understanding of accounting principles prepared the following performance report...
-
Assume Sparkle Co. expects to sell 150 units next month. The unit sales price is $80, unit variable cost is $40, and the fixed costs per month are $5,000. Themargin of safety in terms of sales...
-
Explain why errors in the valuation of inventory at the end of the year are sometimes called counterbalancing or self-correcting.
-
The top 5 stocks in the S&P 500 index, when ranked by market capitalization, make up 22% of the total market capitalization of the S&P 500 index. Numerical estimates of the mean (or expected) rates...
-
I found this to be an interesting topic; I have been reading and looking for a reply, but I have been unsuccessful: An event directly influenced by technology I experienced was how I came to be...
-
Fairfield Company's raw materials inventory transactions for the most recent month are summarized here: Note: Assume, purchase of raw materials is on account. Beginning raw materials Purchases of raw...
-
This case presents an issue that becomes more likely the larger an organization becomes. The legal department of any company is an important part of the organization. The laws and regulations...
-
The Whole Food Nutrition Center uses three bulk grains, A, B, and C, to blend a natural cereal that it sells by the pound. The cost of each bulk grain is indicated in the table below, along with the...
-
For this week's discussion, examine more closely the future as it pertains to sport governance and policy issues for sport organizations: Consider your specific organization for your sport governance...
-
At September 30, the end of Beijing Company's third quarter, the following stockholders' equity accounts are reported. Common stock, $12 par value Paid-in capital in excess of par value, common stock...
-
Design an experiment to demonstrate that RNA transcripts are synthesized in the nucleus of eukaryotes and are subsequently transported to the cytoplasm.
-
Suppose a researcher runs a forward entry statistical multiple regression with a group of 20 candidate predictor variables; the final model includes five predictors. Why are the p values shown on the...
-
What types of research situations often make use of multiple regression analysis with more than two predictors?
-
Describe the guidelines for selecting an appropriate bivariate statistic. That is, what do you need to ask about the nature of the data and the research design in order to choose an appropriate...
-
Create a similar barplot as in Figure 1. 5, but now plot the corresponding proportions of males and females in each of the three situation categories. That is, the heights of the bars should sum up...
-
Import the data set EuStockMarkets from the same website as the iris data set above. The data set contains the daily closing prices of four European stock indices during the 1990s, for 260 working...
-
The iris data set, mentioned in Section1.1, contains various features, including 'Petal.Length' and 'Sepal.Length', of three species of iris: setosa, versicolor, and virginica. (a) Load the data set...
Study smarter with the SolutionInn App