

1. Calculate the missing shipment for 2018 in the Annual Summary Unit Data table. Backlog means the...
Fantastic news! We've Found the answer you've been seeking!
Question:
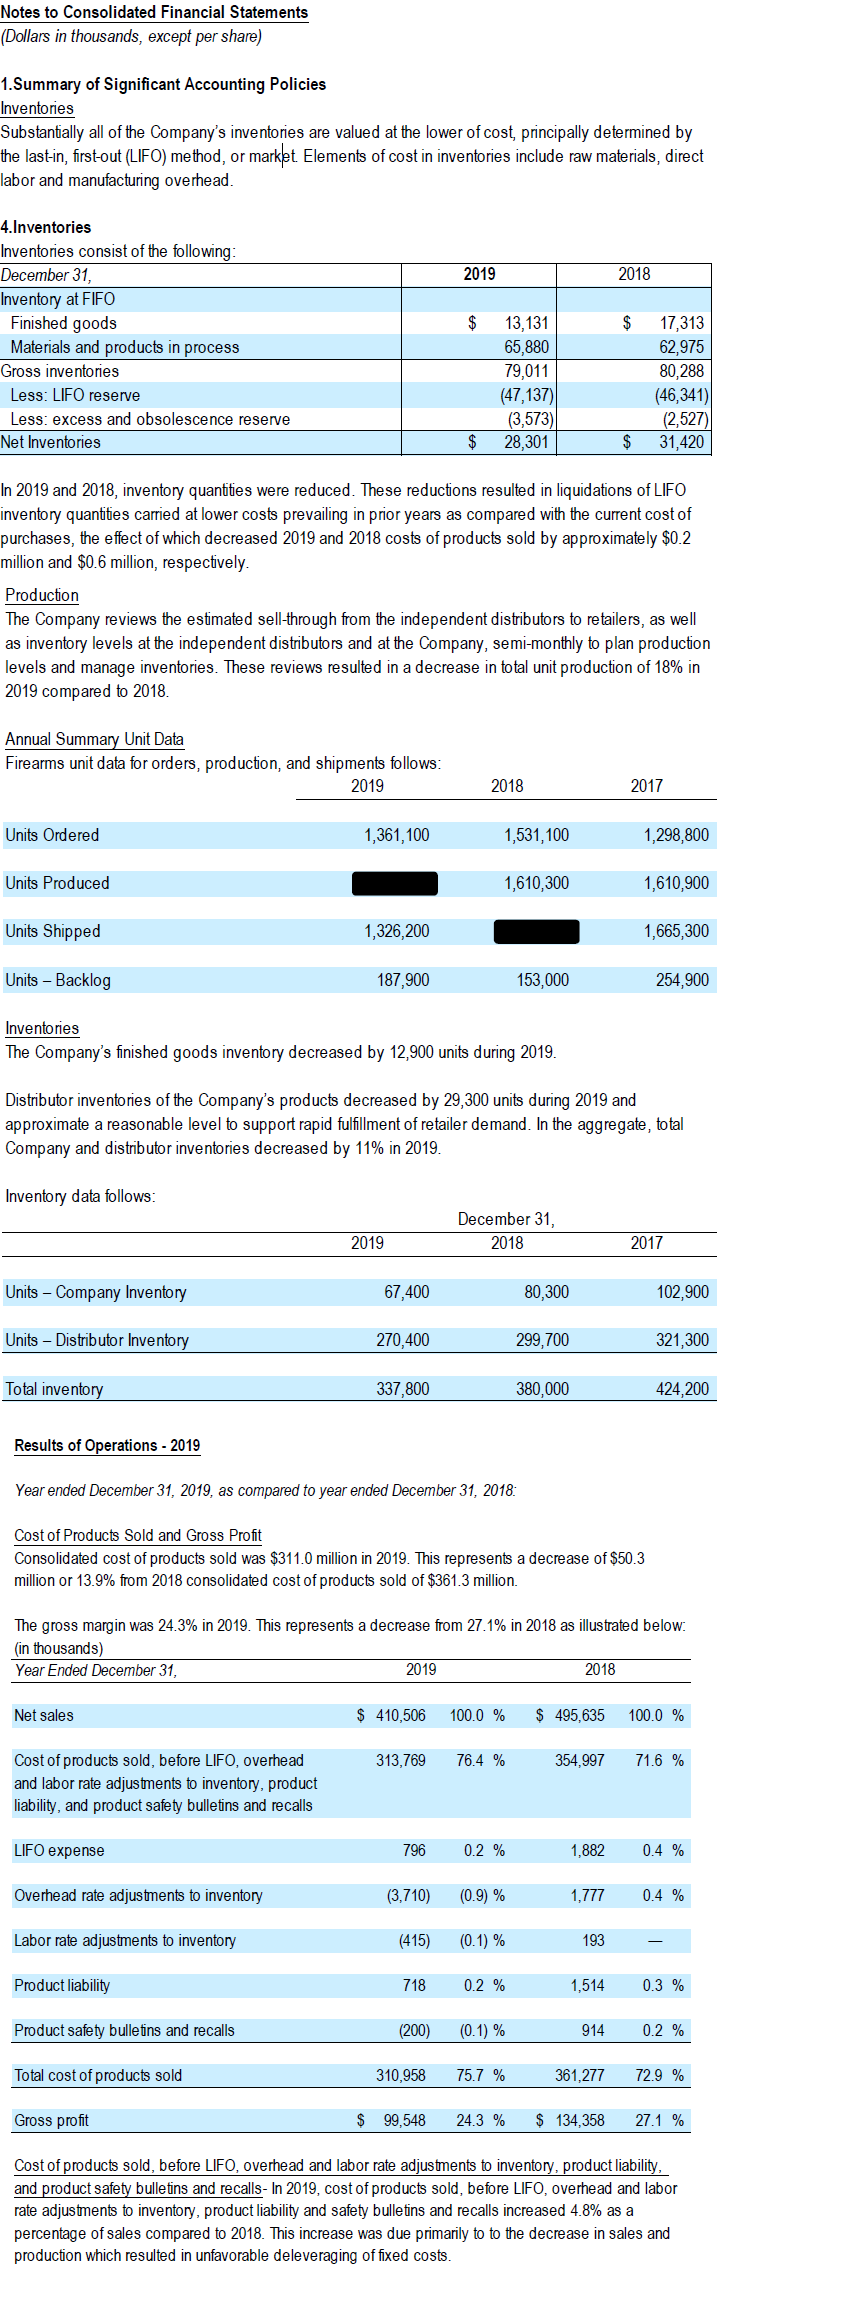
1. Calculate the missing shipment for 2018 in the Annual Summary Unit Data table. Backlog means the volume of orders received but not yet fulfilled (i.e., not shipped).
2. Calculate the missing production for 2019 in the Annual Summary Unit Data table. (Hint: the units of company inventory are given in the Inventories table).
Transcribed Image Text:
Notes to Consolidated Financial Statements (Dollars in thousands, except per share) 1.Summary of Significant Accounting Policies Inventories Substantially all of the Company's inventories are valued at the lower of cost, principally determined by the last-in, first-out (LIFO) method, or market. Elements of cost in inventories include raw materials, direct labor and manufacturing overhead. 4.Inventories Inventories consist of the following: December 31, Inventory at FIFO Finished goods Materials and products in process Gross inventories Less: LIFO reserve Less: excess and obsolescence reserve 2019 2018 $ 13,131 $ 17,313 65,880 62,975 79,011 80,288 (47,137) (46,341) (3,573) (2,527) $ 28,301 $ 31,420 Net Inventories In 2019 and 2018, inventory quantities were reduced. These reductions resulted in liquidations of LIFO inventory quantities carried at lower costs prevailing in prior years as compared with the current cost of purchases, the effect of which decreased 2019 and 2018 costs of products sold by approximately $0.2 million and $0.6 million, respectively. Production The Company reviews the estimated sell-through from the independent distributors to retailers, as well as inventory levels at the independent distributors and at the Company, semi-monthly to plan production levels and manage inventories. These reviews resulted in a decrease in total unit production of 18% in 2019 compared to 2018. Annual Summary Unit Data Firearms unit data for orders, production, and shipments follows: Units Ordered Units Produced Units Shipped Units - Backlog Inventories 2019 2018 2017 1,361,100 1,531,100 1,298,800 1,610,300 1,610,900 1,326,200 1,665,300 187,900 153,000 254,900 The Company's finished goods inventory decreased by 12,900 units during 2019. Distributor inventories of the Company's products decreased by 29,300 units during 2019 and approximate a reasonable level to support rapid fulfillment of retailer demand. In the aggregate, total Company and distributor inventories decreased by 11% in 2019. Inventory data follows: 2019 December 31, 2018 2017 Units Company Inventory 67,400 80,300 102,900 Units Distributor Inventory 270,400 299,700 321,300 Total inventory 337,800 380,000 424,200 Results of Operations - 2019 Year ended December 31, 2019, as compared to year ended December 31, 2018: Cost of Products Sold and Gross Profit Consolidated cost of products sold was $311.0 million in 2019. This represents a decrease of $50.3 million or 13.9% from 2018 consolidated cost of products sold of $361.3 million. The gross margin was 24.3% in 2019. This represents a decrease from 27.1% in 2018 as illustrated below: (in thousands) Year Ended December 31, Net sales Cost of products sold, before LIFO, overhead and labor rate adjustments to inventory, product liability, and product safety bulletins and recalls LIFO expense 2019 2018 $ 410,506 100.0 % $ 495,635 100.0 % 313,769 76.4 % 354,997 71.6 % 796 0.2 % 1,882 0.4 % Overhead rate adjustments to inventory (3,710) (0.9) % 1,777 0.4 % Labor rate adjustments to inventory (415) (0.1) % 193 Product liability 718 0.2 % 1,514 0.3 % Product safety bulletins and recalls (200) (0.1)% 914 0.2 % Total cost of products sold 310,958 75.7 % 361,277 72.9 % Gross profit $ 99,548 24.3 % $ 134,358 27.1 % Cost of products sold, before LIFO, overhead and labor rate adjustments to inventory, product liability, and product safety bulletins and recalls- In 2019, cost of products sold, before LIFO, overhead and labor rate adjustments to inventory, product liability and safety bulletins and recalls increased 4.8% as a percentage of sales compared to 2018. This increase was due primarily to to the decrease in sales and production which resulted in unfavorable deleveraging of fixed costs. Notes to Consolidated Financial Statements (Dollars in thousands, except per share) 1.Summary of Significant Accounting Policies Inventories Substantially all of the Company's inventories are valued at the lower of cost, principally determined by the last-in, first-out (LIFO) method, or market. Elements of cost in inventories include raw materials, direct labor and manufacturing overhead. 4.Inventories Inventories consist of the following: December 31, Inventory at FIFO Finished goods Materials and products in process Gross inventories Less: LIFO reserve Less: excess and obsolescence reserve 2019 2018 $ 13,131 $ 17,313 65,880 62,975 79,011 80,288 (47,137) (46,341) (3,573) (2,527) $ 28,301 $ 31,420 Net Inventories In 2019 and 2018, inventory quantities were reduced. These reductions resulted in liquidations of LIFO inventory quantities carried at lower costs prevailing in prior years as compared with the current cost of purchases, the effect of which decreased 2019 and 2018 costs of products sold by approximately $0.2 million and $0.6 million, respectively. Production The Company reviews the estimated sell-through from the independent distributors to retailers, as well as inventory levels at the independent distributors and at the Company, semi-monthly to plan production levels and manage inventories. These reviews resulted in a decrease in total unit production of 18% in 2019 compared to 2018. Annual Summary Unit Data Firearms unit data for orders, production, and shipments follows: Units Ordered Units Produced Units Shipped Units - Backlog Inventories 2019 2018 2017 1,361,100 1,531,100 1,298,800 1,610,300 1,610,900 1,326,200 1,665,300 187,900 153,000 254,900 The Company's finished goods inventory decreased by 12,900 units during 2019. Distributor inventories of the Company's products decreased by 29,300 units during 2019 and approximate a reasonable level to support rapid fulfillment of retailer demand. In the aggregate, total Company and distributor inventories decreased by 11% in 2019. Inventory data follows: 2019 December 31, 2018 2017 Units Company Inventory 67,400 80,300 102,900 Units Distributor Inventory 270,400 299,700 321,300 Total inventory 337,800 380,000 424,200 Results of Operations - 2019 Year ended December 31, 2019, as compared to year ended December 31, 2018: Cost of Products Sold and Gross Profit Consolidated cost of products sold was $311.0 million in 2019. This represents a decrease of $50.3 million or 13.9% from 2018 consolidated cost of products sold of $361.3 million. The gross margin was 24.3% in 2019. This represents a decrease from 27.1% in 2018 as illustrated below: (in thousands) Year Ended December 31, Net sales Cost of products sold, before LIFO, overhead and labor rate adjustments to inventory, product liability, and product safety bulletins and recalls LIFO expense 2019 2018 $ 410,506 100.0 % $ 495,635 100.0 % 313,769 76.4 % 354,997 71.6 % 796 0.2 % 1,882 0.4 % Overhead rate adjustments to inventory (3,710) (0.9) % 1,777 0.4 % Labor rate adjustments to inventory (415) (0.1) % 193 Product liability 718 0.2 % 1,514 0.3 % Product safety bulletins and recalls (200) (0.1)% 914 0.2 % Total cost of products sold 310,958 75.7 % 361,277 72.9 % Gross profit $ 99,548 24.3 % $ 134,358 27.1 % Cost of products sold, before LIFO, overhead and labor rate adjustments to inventory, product liability, and product safety bulletins and recalls- In 2019, cost of products sold, before LIFO, overhead and labor rate adjustments to inventory, product liability and safety bulletins and recalls increased 4.8% as a percentage of sales compared to 2018. This increase was due primarily to to the decrease in sales and production which resulted in unfavorable deleveraging of fixed costs.
Expert Answer:

Related Book For 

Posted Date:
Students also viewed these accounting questions
-
The term-structure of interest rates shows the mathematical relationship between: Maturities and yield-to-maturity of coupon bonds Maturities and yield-to-maturities of zero coupon bonds Maturities...
-
8. The Happy Limited has: One million ordinary shares in issue; 500 000 10% preference shares in issue, par value R4,50; 2000 8% bonds outstanding, par value R1 000 each. The equity shares currently...
-
You have $5,500.00 to invest and must choose between a no-load, open-end mutual fund with an annual expense ratio of 0.75 percent but no transaction cost and an ETF with an annual expense ratio of...
-
One reason you might choose to sync a SharePoint library to your computer is to Select an answer: have a separate copy that your colleagues can't affect have a separate copy in case SharePoint breaks...
-
Suppose that time between two telephone calls at an office, in minutes, is uniformly distributed on the interval [0, 20]. If there were 15 calls, (i) What is the probability that the longest time...
-
Assume that you believe purchasing power parity (PPP) exists. You expect that inflation in Canada during the next year will be 3%, and inflation in the U.S. will be 8%. Today the spot rate of the...
-
Use responsibility accounting to define an organizational subunit as a cost centre, expense centre, revenue centre, profit centre, or investment centre.
-
Bond X is a premium bond making semiannual payments. The bond pays a 9 percent coupon, has a YTM of 7 percent, and has 13 years to maturity. Bond Y is a discount bond making semiannual payments. This...
-
Raina wants to save money to purchase a car. She buys an annuity with monthly payments that earn 2% interest, compounded monthly. Payments will be made at the end of each month. Find the total value...
-
Consumer snacking behavior is changing. The market for snacks has expanded from chips and crackers to fresh fruits, vegetables, yogurt, pastries, and protein bars. The change in consumer snacking...
-
Given the following information, calculate the cost to consumers, the benefit to producers, the change in government revenue, and the deadweight costs of a proposed 10 percent tariff on personal...
-
Review the assets and liabilities of group decision making. Which methods of improving decision making in organizations help offset the liabilities? How? Why?
-
Which of the following statements is/are correct regarding the auditors use of materiality as it applies to a financial statement audit: a. The auditor is required to report all incidences of...
-
What are the points to be borne in mind in carrying out an investigation on behalf of a banker who wants to lend money to a borrower, which is a company?
-
What are the primary attributes of providers of assurance services? Why are each of the attributes important?
-
Helen, age 66, is a recent widow who has never worked outside the home. She received $250,000 in life insurance proceeds at the death of her husband Paul. Helen has no children. She receives a...
-
If the annual fixed costs are 54,000 dinars, the occupation expense represents 20%, the contribution margin is 25%, and the unit selling price is 40 dinars. Required: Calculate the closing point of...
-
The April 17, 2001, issue of the Wall Street Journal includes an article by James Bandler and Mark Maremont entitled "How Xerox's Plan to Reduce Taxes While Boosting Earnings Backfired." Instructions...
-
Ann Osborne recently graduated from college with a degree in landscape architecture. Her father runs a tree, shrub, and perennial-flower uursery, and her brother has a business delivering lopsoil,...
-
Net income is $132,000. During the year,counts payable increased $10,000, inventory decreased $6,000, and accounts receivable in- creased $12,000. Under the indirect method, net cash provided by...

Study smarter with the SolutionInn App