

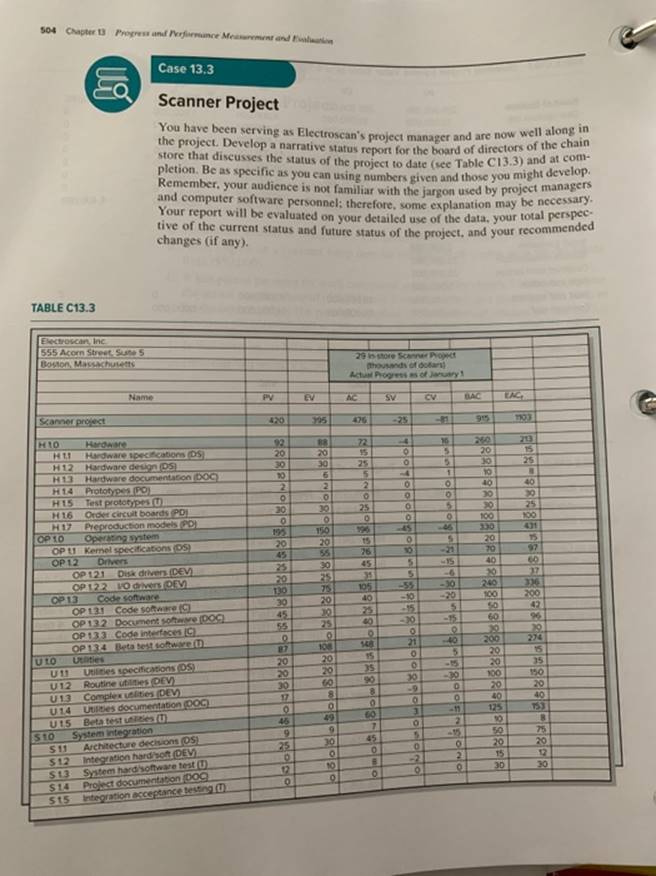
504 Chapter 3 Progress and Performance Mearement and Elion Case 13.3 Scanner Project You have been...
Fantastic news! We've Found the answer you've been seeking!
Question:
Transcribed Image Text:
504 Chapter 3 Progress and Performance Mearement and Elion Case 13.3 Scanner Project You have been serving as Electroscan's project manager and are now well along the project. Develop a narrative status renort for the boand of directors of the cham store that discusses the status of the proiect to date (see Table C13.3) and at Con pletion. Be as specific as you can using numbers given and those you might develop. Remember, your audience is not familiar with the jargon used by project managers and computer software personnel; therefore, some explanation may be necessary. Your report will be evaluated on your detailed use of the data, your total perspec tive of the current status and future status of the project, and your recommended changes (if any). TABLE C13.3 Electroscan, Inc 555 Acom Street Sute5 Boston, Massachusetts 29 in store Scanner Propet thousands of dolars) Actual Progressas of Janury Name PV EV AC SV CV BAC EAC Scanner projest 420 295 476 -25 915 1103 H10 Hardware Hardware spectications (DS) Hardware design DS Hardware documentation DOC) 92 20 30 10 88 20 30 72 240 20 30 10 40 36 15 25 213 15 25 H12 H13 H14 Prototypes (PO) H15 21 40 Test prototypesU Order circuit boards PDI Preproduction models PD Operating system OP U Kermel specifications OS) H16 H17 30 25 30 30 25 30 100 330 20 70 40 20 240 100 50 60 30 200 20 20 100 20 40 125 10 50 20 15 30 100 431 15 97 60 OP 10 150 20 196 15 -45 195 20 45 25 20 130 30 45 55 46 26 45 31 -21 Drivers OP 121 OP 122 VO dvers DEV OP 13 OP 12 10 30 25 75 20 30 25 Disk drivers (DEV 15 -6 -30 -20 Code software OP 131 Code softwre (C OP 132 Document softwe DOC) OP 133 Code interfaces (C) OP 134 Beta test software (. Utlities U11 105 40 25 40 336 200 42 96 29 274 -10 15 -15 148 15 87 108 21 40 UtO 15 35 150 20 40 753 Utilites specifications (DS) Routine utilities DEV) 20 20 30 17 20 20 60 -15 U12 U13 Complex uities (DEV Uttes documentation DOC 30 -9 90 -10 U14 Beta test uies (T) -11 U15 System integration Architecture decisions OS 49 60 46 6. S10 75 20 12 30 $11 30 45 -15 25 $12 Integration hard'soft (DEV System hard'software test () Project documentation (DOC Integration acceptance testing0 -2 S13 $14 $415 12 10 Appendis Salui Seleed Eni 613 Teme . Total direct costs 2260 CPA:DH 3X Activites changed H. 2X 2X Time: 12 Total direct costs: 2460 CP-AD:DH A 3X 3X Activities changed C. H. 3. 2X 2X Direct Cost Indirect Cost Total Cost Duration 1,500 1,450 1,400 1,350 1,300 1,250 3,500 3,490 3,500 3,560 3,660 3,860 17 2,000 2,040 2.100 2,160 2,260 2,460 16 15 14 13 12 The optimum time-cost schedule would be 16 weeks at a cost of $3,490. Chapter 13 8. (S000) Status Report: Ending Period 1 % Complete AC PV CV SV Task EV 25% 25 50 50 -25 -25 Cumulative Totals 25 50 50 -25 -25 (S000) SV Status Report: Ending Period 2 CV Task % Complete EV AC PV 50% 50 100 100 -50 -50 Cumulative Totals 50 100 100 -50 -50 Append Selaions to Selected Esenies 613 3X Time Total direct costs 2240 3X 2. AB-FG Activties changet C. 3. 2X 2X Time 12 3X Total drect costs 240 CP ADH 3X 3X Activites changed C. 2X 2X Duration Direct Cost Indirect Cost Total Cost 3,500 2,000 2.040 2.100 1,500 1,450 1,400 1,350 17 3,490 16 15 3.500 2,160 2,260 2.460 3.560 1,660 14 13 1300 1,250 3.60 12 The optimum time-cost schedule would be 16 weeks a cost of $3.490. Chapter 13 8. Status Report: Ending Perlod 1 (S000) sComplete EV AC PV CV SV Task -25 -25 25% 25 50 50 -25 Cumulative Totals 25 50 50 -25 (S000) Status Report: Ending Perlod 2 Task EV PV CV SV Complete AC -50 -50 -50 S0% 50 100 100 Cumutative Totals 50 100 100 -50 614 Appendia 1 Soltions Selected Esercises ($000) Status Report: Ending Perlod 3 CV PV SV AC EV Task sComplete -100 200 100 100 -100 -150 100% 100 150 A. 350 -100 -250 100 200 Cumulative Totals (S00) Status Report: Ending Period 4 PV CV SV EV AC Task SComplete 100 -100 200 100 100% 100 150 300 550 50 25 150 60% 50% -75 225 475 200 500 -25 -75 Cumulative Totals (S000) Status Report: Ending Perlod 5 EV AC PV CV SV Task SComplete -100 50 100% 100 200 100 200 250 100% 100% 250 450 800 400 450 50 800 800 Cumulative Totals Status Report: Ending Period 6 (S000) Task SComplete EV AC PV CV SV 100% 100 200 100 -100 250 450 100 50 50 50 50 100% 250 200 100% 450 400 100 75% 150 50 Cumulative Totals 950 900 900 50 Status Report: Ending Period 7 (S000) Task S Complete EV AC PV CV SV 100% 100% 100 250 450 200 60 15 1075 200 100 -100 200 400 150 100 50 1100 250 50 50 100% 450 D. 100% 200 50 20% -40 -35 5% Cumulative Totals 15 1000 -25 75 20000 200O 78008 Appendix 1 Solutions to Selected Exercises 615 Status Report: Ending Period 8 (S000) Task % Complete CV SV EV AC PV 100% 100% 100% 100% -100 50 50 50 -50 -70 100 200 200 400 150 350 100 100 250 250 450 200 450 200 E 100% 300 100 -70 30 10% 30 1330 100 1300 rolec Cumulative Totals 1400 -70 Performance Indexes Summary Period EV AC PV SPI CPI PCIB 25 50 50 .50 .50 2% 50 100 100 .50 .50 3% .50 .95 100 200 350 29 5% 3 475 500 550 86 24% 40% 1.00 1.06 800 800 800 1.00 1.06 48% 900 1000 950 900 1.08 .98 54% 1075 1100 1330 1400 1300 1.02 .95 67% 8. (BAC - EV) (EVIAC) (2,000- 1,300) (1,330/1.400) + AC = + 1,400 = 2,105 EAC, = VAC, = BAC - EAC, = 2,000 – 2,105 = -105 %3D With two-thirds of the project completed the forecast is that the project will be $105,000 over budget at completion. 679 504 Chapter 3 Progress and Performance Mearement and Elion Case 13.3 Scanner Project You have been serving as Electroscan's project manager and are now well along the project. Develop a narrative status renort for the boand of directors of the cham store that discusses the status of the proiect to date (see Table C13.3) and at Con pletion. Be as specific as you can using numbers given and those you might develop. Remember, your audience is not familiar with the jargon used by project managers and computer software personnel; therefore, some explanation may be necessary. Your report will be evaluated on your detailed use of the data, your total perspec tive of the current status and future status of the project, and your recommended changes (if any). TABLE C13.3 Electroscan, Inc 555 Acom Street Sute5 Boston, Massachusetts 29 in store Scanner Propet thousands of dolars) Actual Progressas of Janury Name PV EV AC SV CV BAC EAC Scanner projest 420 295 476 -25 915 1103 H10 Hardware Hardware spectications (DS) Hardware design DS Hardware documentation DOC) 92 20 30 10 88 20 30 72 240 20 30 10 40 36 15 25 213 15 25 H12 H13 H14 Prototypes (PO) H15 21 40 Test prototypesU Order circuit boards PDI Preproduction models PD Operating system OP U Kermel specifications OS) H16 H17 30 25 30 30 25 30 100 330 20 70 40 20 240 100 50 60 30 200 20 20 100 20 40 125 10 50 20 15 30 100 431 15 97 60 OP 10 150 20 196 15 -45 195 20 45 25 20 130 30 45 55 46 26 45 31 -21 Drivers OP 121 OP 122 VO dvers DEV OP 13 OP 12 10 30 25 75 20 30 25 Disk drivers (DEV 15 -6 -30 -20 Code software OP 131 Code softwre (C OP 132 Document softwe DOC) OP 133 Code interfaces (C) OP 134 Beta test software (. Utlities U11 105 40 25 40 336 200 42 96 29 274 -10 15 -15 148 15 87 108 21 40 UtO 15 35 150 20 40 753 Utilites specifications (DS) Routine utilities DEV) 20 20 30 17 20 20 60 -15 U12 U13 Complex uities (DEV Uttes documentation DOC 30 -9 90 -10 U14 Beta test uies (T) -11 U15 System integration Architecture decisions OS 49 60 46 6. S10 75 20 12 30 $11 30 45 -15 25 $12 Integration hard'soft (DEV System hard'software test () Project documentation (DOC Integration acceptance testing0 -2 S13 $14 $415 12 10 Appendis Salui Seleed Eni 613 Teme . Total direct costs 2260 CPA:DH 3X Activites changed H. 2X 2X Time: 12 Total direct costs: 2460 CP-AD:DH A 3X 3X Activities changed C. H. 3. 2X 2X Direct Cost Indirect Cost Total Cost Duration 1,500 1,450 1,400 1,350 1,300 1,250 3,500 3,490 3,500 3,560 3,660 3,860 17 2,000 2,040 2.100 2,160 2,260 2,460 16 15 14 13 12 The optimum time-cost schedule would be 16 weeks at a cost of $3,490. Chapter 13 8. (S000) Status Report: Ending Period 1 % Complete AC PV CV SV Task EV 25% 25 50 50 -25 -25 Cumulative Totals 25 50 50 -25 -25 (S000) SV Status Report: Ending Period 2 CV Task % Complete EV AC PV 50% 50 100 100 -50 -50 Cumulative Totals 50 100 100 -50 -50 Append Selaions to Selected Esenies 613 3X Time Total direct costs 2240 3X 2. AB-FG Activties changet C. 3. 2X 2X Time 12 3X Total drect costs 240 CP ADH 3X 3X Activites changed C. 2X 2X Duration Direct Cost Indirect Cost Total Cost 3,500 2,000 2.040 2.100 1,500 1,450 1,400 1,350 17 3,490 16 15 3.500 2,160 2,260 2.460 3.560 1,660 14 13 1300 1,250 3.60 12 The optimum time-cost schedule would be 16 weeks a cost of $3.490. Chapter 13 8. Status Report: Ending Perlod 1 (S000) sComplete EV AC PV CV SV Task -25 -25 25% 25 50 50 -25 Cumulative Totals 25 50 50 -25 (S000) Status Report: Ending Perlod 2 Task EV PV CV SV Complete AC -50 -50 -50 S0% 50 100 100 Cumutative Totals 50 100 100 -50 614 Appendia 1 Soltions Selected Esercises ($000) Status Report: Ending Perlod 3 CV PV SV AC EV Task sComplete -100 200 100 100 -100 -150 100% 100 150 A. 350 -100 -250 100 200 Cumulative Totals (S00) Status Report: Ending Period 4 PV CV SV EV AC Task SComplete 100 -100 200 100 100% 100 150 300 550 50 25 150 60% 50% -75 225 475 200 500 -25 -75 Cumulative Totals (S000) Status Report: Ending Perlod 5 EV AC PV CV SV Task SComplete -100 50 100% 100 200 100 200 250 100% 100% 250 450 800 400 450 50 800 800 Cumulative Totals Status Report: Ending Period 6 (S000) Task SComplete EV AC PV CV SV 100% 100 200 100 -100 250 450 100 50 50 50 50 100% 250 200 100% 450 400 100 75% 150 50 Cumulative Totals 950 900 900 50 Status Report: Ending Period 7 (S000) Task S Complete EV AC PV CV SV 100% 100% 100 250 450 200 60 15 1075 200 100 -100 200 400 150 100 50 1100 250 50 50 100% 450 D. 100% 200 50 20% -40 -35 5% Cumulative Totals 15 1000 -25 75 20000 200O 78008 Appendix 1 Solutions to Selected Exercises 615 Status Report: Ending Period 8 (S000) Task % Complete CV SV EV AC PV 100% 100% 100% 100% -100 50 50 50 -50 -70 100 200 200 400 150 350 100 100 250 250 450 200 450 200 E 100% 300 100 -70 30 10% 30 1330 100 1300 rolec Cumulative Totals 1400 -70 Performance Indexes Summary Period EV AC PV SPI CPI PCIB 25 50 50 .50 .50 2% 50 100 100 .50 .50 3% .50 .95 100 200 350 29 5% 3 475 500 550 86 24% 40% 1.00 1.06 800 800 800 1.00 1.06 48% 900 1000 950 900 1.08 .98 54% 1075 1100 1330 1400 1300 1.02 .95 67% 8. (BAC - EV) (EVIAC) (2,000- 1,300) (1,330/1.400) + AC = + 1,400 = 2,105 EAC, = VAC, = BAC - EAC, = 2,000 – 2,105 = -105 %3D With two-thirds of the project completed the forecast is that the project will be $105,000 over budget at completion. 679 504 Chapter 3 Progress and Performance Mearement and Elion Case 13.3 Scanner Project You have been serving as Electroscan's project manager and are now well along the project. Develop a narrative status renort for the boand of directors of the cham store that discusses the status of the proiect to date (see Table C13.3) and at Con pletion. Be as specific as you can using numbers given and those you might develop. Remember, your audience is not familiar with the jargon used by project managers and computer software personnel; therefore, some explanation may be necessary. Your report will be evaluated on your detailed use of the data, your total perspec tive of the current status and future status of the project, and your recommended changes (if any). TABLE C13.3 Electroscan, Inc 555 Acom Street Sute5 Boston, Massachusetts 29 in store Scanner Propet thousands of dolars) Actual Progressas of Janury Name PV EV AC SV CV BAC EAC Scanner projest 420 295 476 -25 915 1103 H10 Hardware Hardware spectications (DS) Hardware design DS Hardware documentation DOC) 92 20 30 10 88 20 30 72 240 20 30 10 40 36 15 25 213 15 25 H12 H13 H14 Prototypes (PO) H15 21 40 Test prototypesU Order circuit boards PDI Preproduction models PD Operating system OP U Kermel specifications OS) H16 H17 30 25 30 30 25 30 100 330 20 70 40 20 240 100 50 60 30 200 20 20 100 20 40 125 10 50 20 15 30 100 431 15 97 60 OP 10 150 20 196 15 -45 195 20 45 25 20 130 30 45 55 46 26 45 31 -21 Drivers OP 121 OP 122 VO dvers DEV OP 13 OP 12 10 30 25 75 20 30 25 Disk drivers (DEV 15 -6 -30 -20 Code software OP 131 Code softwre (C OP 132 Document softwe DOC) OP 133 Code interfaces (C) OP 134 Beta test software (. Utlities U11 105 40 25 40 336 200 42 96 29 274 -10 15 -15 148 15 87 108 21 40 UtO 15 35 150 20 40 753 Utilites specifications (DS) Routine utilities DEV) 20 20 30 17 20 20 60 -15 U12 U13 Complex uities (DEV Uttes documentation DOC 30 -9 90 -10 U14 Beta test uies (T) -11 U15 System integration Architecture decisions OS 49 60 46 6. S10 75 20 12 30 $11 30 45 -15 25 $12 Integration hard'soft (DEV System hard'software test () Project documentation (DOC Integration acceptance testing0 -2 S13 $14 $415 12 10 Appendis Salui Seleed Eni 613 Teme . Total direct costs 2260 CPA:DH 3X Activites changed H. 2X 2X Time: 12 Total direct costs: 2460 CP-AD:DH A 3X 3X Activities changed C. H. 3. 2X 2X Direct Cost Indirect Cost Total Cost Duration 1,500 1,450 1,400 1,350 1,300 1,250 3,500 3,490 3,500 3,560 3,660 3,860 17 2,000 2,040 2.100 2,160 2,260 2,460 16 15 14 13 12 The optimum time-cost schedule would be 16 weeks at a cost of $3,490. Chapter 13 8. (S000) Status Report: Ending Period 1 % Complete AC PV CV SV Task EV 25% 25 50 50 -25 -25 Cumulative Totals 25 50 50 -25 -25 (S000) SV Status Report: Ending Period 2 CV Task % Complete EV AC PV 50% 50 100 100 -50 -50 Cumulative Totals 50 100 100 -50 -50 Append Selaions to Selected Esenies 613 3X Time Total direct costs 2240 3X 2. AB-FG Activties changet C. 3. 2X 2X Time 12 3X Total drect costs 240 CP ADH 3X 3X Activites changed C. 2X 2X Duration Direct Cost Indirect Cost Total Cost 3,500 2,000 2.040 2.100 1,500 1,450 1,400 1,350 17 3,490 16 15 3.500 2,160 2,260 2.460 3.560 1,660 14 13 1300 1,250 3.60 12 The optimum time-cost schedule would be 16 weeks a cost of $3.490. Chapter 13 8. Status Report: Ending Perlod 1 (S000) sComplete EV AC PV CV SV Task -25 -25 25% 25 50 50 -25 Cumulative Totals 25 50 50 -25 (S000) Status Report: Ending Perlod 2 Task EV PV CV SV Complete AC -50 -50 -50 S0% 50 100 100 Cumutative Totals 50 100 100 -50 614 Appendia 1 Soltions Selected Esercises ($000) Status Report: Ending Perlod 3 CV PV SV AC EV Task sComplete -100 200 100 100 -100 -150 100% 100 150 A. 350 -100 -250 100 200 Cumulative Totals (S00) Status Report: Ending Period 4 PV CV SV EV AC Task SComplete 100 -100 200 100 100% 100 150 300 550 50 25 150 60% 50% -75 225 475 200 500 -25 -75 Cumulative Totals (S000) Status Report: Ending Perlod 5 EV AC PV CV SV Task SComplete -100 50 100% 100 200 100 200 250 100% 100% 250 450 800 400 450 50 800 800 Cumulative Totals Status Report: Ending Period 6 (S000) Task SComplete EV AC PV CV SV 100% 100 200 100 -100 250 450 100 50 50 50 50 100% 250 200 100% 450 400 100 75% 150 50 Cumulative Totals 950 900 900 50 Status Report: Ending Period 7 (S000) Task S Complete EV AC PV CV SV 100% 100% 100 250 450 200 60 15 1075 200 100 -100 200 400 150 100 50 1100 250 50 50 100% 450 D. 100% 200 50 20% -40 -35 5% Cumulative Totals 15 1000 -25 75 20000 200O 78008 Appendix 1 Solutions to Selected Exercises 615 Status Report: Ending Period 8 (S000) Task % Complete CV SV EV AC PV 100% 100% 100% 100% -100 50 50 50 -50 -70 100 200 200 400 150 350 100 100 250 250 450 200 450 200 E 100% 300 100 -70 30 10% 30 1330 100 1300 rolec Cumulative Totals 1400 -70 Performance Indexes Summary Period EV AC PV SPI CPI PCIB 25 50 50 .50 .50 2% 50 100 100 .50 .50 3% .50 .95 100 200 350 29 5% 3 475 500 550 86 24% 40% 1.00 1.06 800 800 800 1.00 1.06 48% 900 1000 950 900 1.08 .98 54% 1075 1100 1330 1400 1300 1.02 .95 67% 8. (BAC - EV) (EVIAC) (2,000- 1,300) (1,330/1.400) + AC = + 1,400 = 2,105 EAC, = VAC, = BAC - EAC, = 2,000 – 2,105 = -105 %3D With two-thirds of the project completed the forecast is that the project will be $105,000 over budget at completion. 679 504 Chapter 3 Progress and Performance Mearement and Elion Case 13.3 Scanner Project You have been serving as Electroscan's project manager and are now well along the project. Develop a narrative status renort for the boand of directors of the cham store that discusses the status of the proiect to date (see Table C13.3) and at Con pletion. Be as specific as you can using numbers given and those you might develop. Remember, your audience is not familiar with the jargon used by project managers and computer software personnel; therefore, some explanation may be necessary. Your report will be evaluated on your detailed use of the data, your total perspec tive of the current status and future status of the project, and your recommended changes (if any). TABLE C13.3 Electroscan, Inc 555 Acom Street Sute5 Boston, Massachusetts 29 in store Scanner Propet thousands of dolars) Actual Progressas of Janury Name PV EV AC SV CV BAC EAC Scanner projest 420 295 476 -25 915 1103 H10 Hardware Hardware spectications (DS) Hardware design DS Hardware documentation DOC) 92 20 30 10 88 20 30 72 240 20 30 10 40 36 15 25 213 15 25 H12 H13 H14 Prototypes (PO) H15 21 40 Test prototypesU Order circuit boards PDI Preproduction models PD Operating system OP U Kermel specifications OS) H16 H17 30 25 30 30 25 30 100 330 20 70 40 20 240 100 50 60 30 200 20 20 100 20 40 125 10 50 20 15 30 100 431 15 97 60 OP 10 150 20 196 15 -45 195 20 45 25 20 130 30 45 55 46 26 45 31 -21 Drivers OP 121 OP 122 VO dvers DEV OP 13 OP 12 10 30 25 75 20 30 25 Disk drivers (DEV 15 -6 -30 -20 Code software OP 131 Code softwre (C OP 132 Document softwe DOC) OP 133 Code interfaces (C) OP 134 Beta test software (. Utlities U11 105 40 25 40 336 200 42 96 29 274 -10 15 -15 148 15 87 108 21 40 UtO 15 35 150 20 40 753 Utilites specifications (DS) Routine utilities DEV) 20 20 30 17 20 20 60 -15 U12 U13 Complex uities (DEV Uttes documentation DOC 30 -9 90 -10 U14 Beta test uies (T) -11 U15 System integration Architecture decisions OS 49 60 46 6. S10 75 20 12 30 $11 30 45 -15 25 $12 Integration hard'soft (DEV System hard'software test () Project documentation (DOC Integration acceptance testing0 -2 S13 $14 $415 12 10 Appendis Salui Seleed Eni 613 Teme . Total direct costs 2260 CPA:DH 3X Activites changed H. 2X 2X Time: 12 Total direct costs: 2460 CP-AD:DH A 3X 3X Activities changed C. H. 3. 2X 2X Direct Cost Indirect Cost Total Cost Duration 1,500 1,450 1,400 1,350 1,300 1,250 3,500 3,490 3,500 3,560 3,660 3,860 17 2,000 2,040 2.100 2,160 2,260 2,460 16 15 14 13 12 The optimum time-cost schedule would be 16 weeks at a cost of $3,490. Chapter 13 8. (S000) Status Report: Ending Period 1 % Complete AC PV CV SV Task EV 25% 25 50 50 -25 -25 Cumulative Totals 25 50 50 -25 -25 (S000) SV Status Report: Ending Period 2 CV Task % Complete EV AC PV 50% 50 100 100 -50 -50 Cumulative Totals 50 100 100 -50 -50 Append Selaions to Selected Esenies 613 3X Time Total direct costs 2240 3X 2. AB-FG Activties changet C. 3. 2X 2X Time 12 3X Total drect costs 240 CP ADH 3X 3X Activites changed C. 2X 2X Duration Direct Cost Indirect Cost Total Cost 3,500 2,000 2.040 2.100 1,500 1,450 1,400 1,350 17 3,490 16 15 3.500 2,160 2,260 2.460 3.560 1,660 14 13 1300 1,250 3.60 12 The optimum time-cost schedule would be 16 weeks a cost of $3.490. Chapter 13 8. Status Report: Ending Perlod 1 (S000) sComplete EV AC PV CV SV Task -25 -25 25% 25 50 50 -25 Cumulative Totals 25 50 50 -25 (S000) Status Report: Ending Perlod 2 Task EV PV CV SV Complete AC -50 -50 -50 S0% 50 100 100 Cumutative Totals 50 100 100 -50 614 Appendia 1 Soltions Selected Esercises ($000) Status Report: Ending Perlod 3 CV PV SV AC EV Task sComplete -100 200 100 100 -100 -150 100% 100 150 A. 350 -100 -250 100 200 Cumulative Totals (S00) Status Report: Ending Period 4 PV CV SV EV AC Task SComplete 100 -100 200 100 100% 100 150 300 550 50 25 150 60% 50% -75 225 475 200 500 -25 -75 Cumulative Totals (S000) Status Report: Ending Perlod 5 EV AC PV CV SV Task SComplete -100 50 100% 100 200 100 200 250 100% 100% 250 450 800 400 450 50 800 800 Cumulative Totals Status Report: Ending Period 6 (S000) Task SComplete EV AC PV CV SV 100% 100 200 100 -100 250 450 100 50 50 50 50 100% 250 200 100% 450 400 100 75% 150 50 Cumulative Totals 950 900 900 50 Status Report: Ending Period 7 (S000) Task S Complete EV AC PV CV SV 100% 100% 100 250 450 200 60 15 1075 200 100 -100 200 400 150 100 50 1100 250 50 50 100% 450 D. 100% 200 50 20% -40 -35 5% Cumulative Totals 15 1000 -25 75 20000 200O 78008 Appendix 1 Solutions to Selected Exercises 615 Status Report: Ending Period 8 (S000) Task % Complete CV SV EV AC PV 100% 100% 100% 100% -100 50 50 50 -50 -70 100 200 200 400 150 350 100 100 250 250 450 200 450 200 E 100% 300 100 -70 30 10% 30 1330 100 1300 rolec Cumulative Totals 1400 -70 Performance Indexes Summary Period EV AC PV SPI CPI PCIB 25 50 50 .50 .50 2% 50 100 100 .50 .50 3% .50 .95 100 200 350 29 5% 3 475 500 550 86 24% 40% 1.00 1.06 800 800 800 1.00 1.06 48% 900 1000 950 900 1.08 .98 54% 1075 1100 1330 1400 1300 1.02 .95 67% 8. (BAC - EV) (EVIAC) (2,000- 1,300) (1,330/1.400) + AC = + 1,400 = 2,105 EAC, = VAC, = BAC - EAC, = 2,000 – 2,105 = -105 %3D With two-thirds of the project completed the forecast is that the project will be $105,000 over budget at completion. 679 504 Chapter 3 Progress and Performance Mearement and Elion Case 13.3 Scanner Project You have been serving as Electroscan's project manager and are now well along the project. Develop a narrative status renort for the boand of directors of the cham store that discusses the status of the proiect to date (see Table C13.3) and at Con pletion. Be as specific as you can using numbers given and those you might develop. Remember, your audience is not familiar with the jargon used by project managers and computer software personnel; therefore, some explanation may be necessary. Your report will be evaluated on your detailed use of the data, your total perspec tive of the current status and future status of the project, and your recommended changes (if any). TABLE C13.3 Electroscan, Inc 555 Acom Street Sute5 Boston, Massachusetts 29 in store Scanner Propet thousands of dolars) Actual Progressas of Janury Name PV EV AC SV CV BAC EAC Scanner projest 420 295 476 -25 915 1103 H10 Hardware Hardware spectications (DS) Hardware design DS Hardware documentation DOC) 92 20 30 10 88 20 30 72 240 20 30 10 40 36 15 25 213 15 25 H12 H13 H14 Prototypes (PO) H15 21 40 Test prototypesU Order circuit boards PDI Preproduction models PD Operating system OP U Kermel specifications OS) H16 H17 30 25 30 30 25 30 100 330 20 70 40 20 240 100 50 60 30 200 20 20 100 20 40 125 10 50 20 15 30 100 431 15 97 60 OP 10 150 20 196 15 -45 195 20 45 25 20 130 30 45 55 46 26 45 31 -21 Drivers OP 121 OP 122 VO dvers DEV OP 13 OP 12 10 30 25 75 20 30 25 Disk drivers (DEV 15 -6 -30 -20 Code software OP 131 Code softwre (C OP 132 Document softwe DOC) OP 133 Code interfaces (C) OP 134 Beta test software (. Utlities U11 105 40 25 40 336 200 42 96 29 274 -10 15 -15 148 15 87 108 21 40 UtO 15 35 150 20 40 753 Utilites specifications (DS) Routine utilities DEV) 20 20 30 17 20 20 60 -15 U12 U13 Complex uities (DEV Uttes documentation DOC 30 -9 90 -10 U14 Beta test uies (T) -11 U15 System integration Architecture decisions OS 49 60 46 6. S10 75 20 12 30 $11 30 45 -15 25 $12 Integration hard'soft (DEV System hard'software test () Project documentation (DOC Integration acceptance testing0 -2 S13 $14 $415 12 10 Appendis Salui Seleed Eni 613 Teme . Total direct costs 2260 CPA:DH 3X Activites changed H. 2X 2X Time: 12 Total direct costs: 2460 CP-AD:DH A 3X 3X Activities changed C. H. 3. 2X 2X Direct Cost Indirect Cost Total Cost Duration 1,500 1,450 1,400 1,350 1,300 1,250 3,500 3,490 3,500 3,560 3,660 3,860 17 2,000 2,040 2.100 2,160 2,260 2,460 16 15 14 13 12 The optimum time-cost schedule would be 16 weeks at a cost of $3,490. Chapter 13 8. (S000) Status Report: Ending Period 1 % Complete AC PV CV SV Task EV 25% 25 50 50 -25 -25 Cumulative Totals 25 50 50 -25 -25 (S000) SV Status Report: Ending Period 2 CV Task % Complete EV AC PV 50% 50 100 100 -50 -50 Cumulative Totals 50 100 100 -50 -50 Append Selaions to Selected Esenies 613 3X Time Total direct costs 2240 3X 2. AB-FG Activties changet C. 3. 2X 2X Time 12 3X Total drect costs 240 CP ADH 3X 3X Activites changed C. 2X 2X Duration Direct Cost Indirect Cost Total Cost 3,500 2,000 2.040 2.100 1,500 1,450 1,400 1,350 17 3,490 16 15 3.500 2,160 2,260 2.460 3.560 1,660 14 13 1300 1,250 3.60 12 The optimum time-cost schedule would be 16 weeks a cost of $3.490. Chapter 13 8. Status Report: Ending Perlod 1 (S000) sComplete EV AC PV CV SV Task -25 -25 25% 25 50 50 -25 Cumulative Totals 25 50 50 -25 (S000) Status Report: Ending Perlod 2 Task EV PV CV SV Complete AC -50 -50 -50 S0% 50 100 100 Cumutative Totals 50 100 100 -50 614 Appendia 1 Soltions Selected Esercises ($000) Status Report: Ending Perlod 3 CV PV SV AC EV Task sComplete -100 200 100 100 -100 -150 100% 100 150 A. 350 -100 -250 100 200 Cumulative Totals (S00) Status Report: Ending Period 4 PV CV SV EV AC Task SComplete 100 -100 200 100 100% 100 150 300 550 50 25 150 60% 50% -75 225 475 200 500 -25 -75 Cumulative Totals (S000) Status Report: Ending Perlod 5 EV AC PV CV SV Task SComplete -100 50 100% 100 200 100 200 250 100% 100% 250 450 800 400 450 50 800 800 Cumulative Totals Status Report: Ending Period 6 (S000) Task SComplete EV AC PV CV SV 100% 100 200 100 -100 250 450 100 50 50 50 50 100% 250 200 100% 450 400 100 75% 150 50 Cumulative Totals 950 900 900 50 Status Report: Ending Period 7 (S000) Task S Complete EV AC PV CV SV 100% 100% 100 250 450 200 60 15 1075 200 100 -100 200 400 150 100 50 1100 250 50 50 100% 450 D. 100% 200 50 20% -40 -35 5% Cumulative Totals 15 1000 -25 75 20000 200O 78008 Appendix 1 Solutions to Selected Exercises 615 Status Report: Ending Period 8 (S000) Task % Complete CV SV EV AC PV 100% 100% 100% 100% -100 50 50 50 -50 -70 100 200 200 400 150 350 100 100 250 250 450 200 450 200 E 100% 300 100 -70 30 10% 30 1330 100 1300 rolec Cumulative Totals 1400 -70 Performance Indexes Summary Period EV AC PV SPI CPI PCIB 25 50 50 .50 .50 2% 50 100 100 .50 .50 3% .50 .95 100 200 350 29 5% 3 475 500 550 86 24% 40% 1.00 1.06 800 800 800 1.00 1.06 48% 900 1000 950 900 1.08 .98 54% 1075 1100 1330 1400 1300 1.02 .95 67% 8. (BAC - EV) (EVIAC) (2,000- 1,300) (1,330/1.400) + AC = + 1,400 = 2,105 EAC, = VAC, = BAC - EAC, = 2,000 – 2,105 = -105 %3D With two-thirds of the project completed the forecast is that the project will be $105,000 over budget at completion. 679 504 Chapter 3 Progress and Performance Mearement and Elion Case 13.3 Scanner Project You have been serving as Electroscan's project manager and are now well along the project. Develop a narrative status renort for the boand of directors of the cham store that discusses the status of the proiect to date (see Table C13.3) and at Con pletion. Be as specific as you can using numbers given and those you might develop. Remember, your audience is not familiar with the jargon used by project managers and computer software personnel; therefore, some explanation may be necessary. Your report will be evaluated on your detailed use of the data, your total perspec tive of the current status and future status of the project, and your recommended changes (if any). TABLE C13.3 Electroscan, Inc 555 Acom Street Sute5 Boston, Massachusetts 29 in store Scanner Propet thousands of dolars) Actual Progressas of Janury Name PV EV AC SV CV BAC EAC Scanner projest 420 295 476 -25 915 1103 H10 Hardware Hardware spectications (DS) Hardware design DS Hardware documentation DOC) 92 20 30 10 88 20 30 72 240 20 30 10 40 36 15 25 213 15 25 H12 H13 H14 Prototypes (PO) H15 21 40 Test prototypesU Order circuit boards PDI Preproduction models PD Operating system OP U Kermel specifications OS) H16 H17 30 25 30 30 25 30 100 330 20 70 40 20 240 100 50 60 30 200 20 20 100 20 40 125 10 50 20 15 30 100 431 15 97 60 OP 10 150 20 196 15 -45 195 20 45 25 20 130 30 45 55 46 26 45 31 -21 Drivers OP 121 OP 122 VO dvers DEV OP 13 OP 12 10 30 25 75 20 30 25 Disk drivers (DEV 15 -6 -30 -20 Code software OP 131 Code softwre (C OP 132 Document softwe DOC) OP 133 Code interfaces (C) OP 134 Beta test software (. Utlities U11 105 40 25 40 336 200 42 96 29 274 -10 15 -15 148 15 87 108 21 40 UtO 15 35 150 20 40 753 Utilites specifications (DS) Routine utilities DEV) 20 20 30 17 20 20 60 -15 U12 U13 Complex uities (DEV Uttes documentation DOC 30 -9 90 -10 U14 Beta test uies (T) -11 U15 System integration Architecture decisions OS 49 60 46 6. S10 75 20 12 30 $11 30 45 -15 25 $12 Integration hard'soft (DEV System hard'software test () Project documentation (DOC Integration acceptance testing0 -2 S13 $14 $415 12 10 Appendis Salui Seleed Eni 613 Teme . Total direct costs 2260 CPA:DH 3X Activites changed H. 2X 2X Time: 12 Total direct costs: 2460 CP-AD:DH A 3X 3X Activities changed C. H. 3. 2X 2X Direct Cost Indirect Cost Total Cost Duration 1,500 1,450 1,400 1,350 1,300 1,250 3,500 3,490 3,500 3,560 3,660 3,860 17 2,000 2,040 2.100 2,160 2,260 2,460 16 15 14 13 12 The optimum time-cost schedule would be 16 weeks at a cost of $3,490. Chapter 13 8. (S000) Status Report: Ending Period 1 % Complete AC PV CV SV Task EV 25% 25 50 50 -25 -25 Cumulative Totals 25 50 50 -25 -25 (S000) SV Status Report: Ending Period 2 CV Task % Complete EV AC PV 50% 50 100 100 -50 -50 Cumulative Totals 50 100 100 -50 -50 Append Selaions to Selected Esenies 613 3X Time Total direct costs 2240 3X 2. AB-FG Activties changet C. 3. 2X 2X Time 12 3X Total drect costs 240 CP ADH 3X 3X Activites changed C. 2X 2X Duration Direct Cost Indirect Cost Total Cost 3,500 2,000 2.040 2.100 1,500 1,450 1,400 1,350 17 3,490 16 15 3.500 2,160 2,260 2.460 3.560 1,660 14 13 1300 1,250 3.60 12 The optimum time-cost schedule would be 16 weeks a cost of $3.490. Chapter 13 8. Status Report: Ending Perlod 1 (S000) sComplete EV AC PV CV SV Task -25 -25 25% 25 50 50 -25 Cumulative Totals 25 50 50 -25 (S000) Status Report: Ending Perlod 2 Task EV PV CV SV Complete AC -50 -50 -50 S0% 50 100 100 Cumutative Totals 50 100 100 -50 614 Appendia 1 Soltions Selected Esercises ($000) Status Report: Ending Perlod 3 CV PV SV AC EV Task sComplete -100 200 100 100 -100 -150 100% 100 150 A. 350 -100 -250 100 200 Cumulative Totals (S00) Status Report: Ending Period 4 PV CV SV EV AC Task SComplete 100 -100 200 100 100% 100 150 300 550 50 25 150 60% 50% -75 225 475 200 500 -25 -75 Cumulative Totals (S000) Status Report: Ending Perlod 5 EV AC PV CV SV Task SComplete -100 50 100% 100 200 100 200 250 100% 100% 250 450 800 400 450 50 800 800 Cumulative Totals Status Report: Ending Period 6 (S000) Task SComplete EV AC PV CV SV 100% 100 200 100 -100 250 450 100 50 50 50 50 100% 250 200 100% 450 400 100 75% 150 50 Cumulative Totals 950 900 900 50 Status Report: Ending Period 7 (S000) Task S Complete EV AC PV CV SV 100% 100% 100 250 450 200 60 15 1075 200 100 -100 200 400 150 100 50 1100 250 50 50 100% 450 D. 100% 200 50 20% -40 -35 5% Cumulative Totals 15 1000 -25 75 20000 200O 78008 Appendix 1 Solutions to Selected Exercises 615 Status Report: Ending Period 8 (S000) Task % Complete CV SV EV AC PV 100% 100% 100% 100% -100 50 50 50 -50 -70 100 200 200 400 150 350 100 100 250 250 450 200 450 200 E 100% 300 100 -70 30 10% 30 1330 100 1300 rolec Cumulative Totals 1400 -70 Performance Indexes Summary Period EV AC PV SPI CPI PCIB 25 50 50 .50 .50 2% 50 100 100 .50 .50 3% .50 .95 100 200 350 29 5% 3 475 500 550 86 24% 40% 1.00 1.06 800 800 800 1.00 1.06 48% 900 1000 950 900 1.08 .98 54% 1075 1100 1330 1400 1300 1.02 .95 67% 8. (BAC - EV) (EVIAC) (2,000- 1,300) (1,330/1.400) + AC = + 1,400 = 2,105 EAC, = VAC, = BAC - EAC, = 2,000 – 2,105 = -105 %3D With two-thirds of the project completed the forecast is that the project will be $105,000 over budget at completion. 679 504 Chapter 3 Progress and Performance Mearement and Elion Case 13.3 Scanner Project You have been serving as Electroscan's project manager and are now well along the project. Develop a narrative status renort for the boand of directors of the cham store that discusses the status of the proiect to date (see Table C13.3) and at Con pletion. Be as specific as you can using numbers given and those you might develop. Remember, your audience is not familiar with the jargon used by project managers and computer software personnel; therefore, some explanation may be necessary. Your report will be evaluated on your detailed use of the data, your total perspec tive of the current status and future status of the project, and your recommended changes (if any). TABLE C13.3 Electroscan, Inc 555 Acom Street Sute5 Boston, Massachusetts 29 in store Scanner Propet thousands of dolars) Actual Progressas of Janury Name PV EV AC SV CV BAC EAC Scanner projest 420 295 476 -25 915 1103 H10 Hardware Hardware spectications (DS) Hardware design DS Hardware documentation DOC) 92 20 30 10 88 20 30 72 240 20 30 10 40 36 15 25 213 15 25 H12 H13 H14 Prototypes (PO) H15 21 40 Test prototypesU Order circuit boards PDI Preproduction models PD Operating system OP U Kermel specifications OS) H16 H17 30 25 30 30 25 30 100 330 20 70 40 20 240 100 50 60 30 200 20 20 100 20 40 125 10 50 20 15 30 100 431 15 97 60 OP 10 150 20 196 15 -45 195 20 45 25 20 130 30 45 55 46 26 45 31 -21 Drivers OP 121 OP 122 VO dvers DEV OP 13 OP 12 10 30 25 75 20 30 25 Disk drivers (DEV 15 -6 -30 -20 Code software OP 131 Code softwre (C OP 132 Document softwe DOC) OP 133 Code interfaces (C) OP 134 Beta test software (. Utlities U11 105 40 25 40 336 200 42 96 29 274 -10 15 -15 148 15 87 108 21 40 UtO 15 35 150 20 40 753 Utilites specifications (DS) Routine utilities DEV) 20 20 30 17 20 20 60 -15 U12 U13 Complex uities (DEV Uttes documentation DOC 30 -9 90 -10 U14 Beta test uies (T) -11 U15 System integration Architecture decisions OS 49 60 46 6. S10 75 20 12 30 $11 30 45 -15 25 $12 Integration hard'soft (DEV System hard'software test () Project documentation (DOC Integration acceptance testing0 -2 S13 $14 $415 12 10 Appendis Salui Seleed Eni 613 Teme . Total direct costs 2260 CPA:DH 3X Activites changed H. 2X 2X Time: 12 Total direct costs: 2460 CP-AD:DH A 3X 3X Activities changed C. H. 3. 2X 2X Direct Cost Indirect Cost Total Cost Duration 1,500 1,450 1,400 1,350 1,300 1,250 3,500 3,490 3,500 3,560 3,660 3,860 17 2,000 2,040 2.100 2,160 2,260 2,460 16 15 14 13 12 The optimum time-cost schedule would be 16 weeks at a cost of $3,490. Chapter 13 8. (S000) Status Report: Ending Period 1 % Complete AC PV CV SV Task EV 25% 25 50 50 -25 -25 Cumulative Totals 25 50 50 -25 -25 (S000) SV Status Report: Ending Period 2 CV Task % Complete EV AC PV 50% 50 100 100 -50 -50 Cumulative Totals 50 100 100 -50 -50 Append Selaions to Selected Esenies 613 3X Time Total direct costs 2240 3X 2. AB-FG Activties changet C. 3. 2X 2X Time 12 3X Total drect costs 240 CP ADH 3X 3X Activites changed C. 2X 2X Duration Direct Cost Indirect Cost Total Cost 3,500 2,000 2.040 2.100 1,500 1,450 1,400 1,350 17 3,490 16 15 3.500 2,160 2,260 2.460 3.560 1,660 14 13 1300 1,250 3.60 12 The optimum time-cost schedule would be 16 weeks a cost of $3.490. Chapter 13 8. Status Report: Ending Perlod 1 (S000) sComplete EV AC PV CV SV Task -25 -25 25% 25 50 50 -25 Cumulative Totals 25 50 50 -25 (S000) Status Report: Ending Perlod 2 Task EV PV CV SV Complete AC -50 -50 -50 S0% 50 100 100 Cumutative Totals 50 100 100 -50 614 Appendia 1 Soltions Selected Esercises ($000) Status Report: Ending Perlod 3 CV PV SV AC EV Task sComplete -100 200 100 100 -100 -150 100% 100 150 A. 350 -100 -250 100 200 Cumulative Totals (S00) Status Report: Ending Period 4 PV CV SV EV AC Task SComplete 100 -100 200 100 100% 100 150 300 550 50 25 150 60% 50% -75 225 475 200 500 -25 -75 Cumulative Totals (S000) Status Report: Ending Perlod 5 EV AC PV CV SV Task SComplete -100 50 100% 100 200 100 200 250 100% 100% 250 450 800 400 450 50 800 800 Cumulative Totals Status Report: Ending Period 6 (S000) Task SComplete EV AC PV CV SV 100% 100 200 100 -100 250 450 100 50 50 50 50 100% 250 200 100% 450 400 100 75% 150 50 Cumulative Totals 950 900 900 50 Status Report: Ending Period 7 (S000) Task S Complete EV AC PV CV SV 100% 100% 100 250 450 200 60 15 1075 200 100 -100 200 400 150 100 50 1100 250 50 50 100% 450 D. 100% 200 50 20% -40 -35 5% Cumulative Totals 15 1000 -25 75 20000 200O 78008 Appendix 1 Solutions to Selected Exercises 615 Status Report: Ending Period 8 (S000) Task % Complete CV SV EV AC PV 100% 100% 100% 100% -100 50 50 50 -50 -70 100 200 200 400 150 350 100 100 250 250 450 200 450 200 E 100% 300 100 -70 30 10% 30 1330 100 1300 rolec Cumulative Totals 1400 -70 Performance Indexes Summary Period EV AC PV SPI CPI PCIB 25 50 50 .50 .50 2% 50 100 100 .50 .50 3% .50 .95 100 200 350 29 5% 3 475 500 550 86 24% 40% 1.00 1.06 800 800 800 1.00 1.06 48% 900 1000 950 900 1.08 .98 54% 1075 1100 1330 1400 1300 1.02 .95 67% 8. (BAC - EV) (EVIAC) (2,000- 1,300) (1,330/1.400) + AC = + 1,400 = 2,105 EAC, = VAC, = BAC - EAC, = 2,000 – 2,105 = -105 %3D With two-thirds of the project completed the forecast is that the project will be $105,000 over budget at completion. 679 504 Chapter 3 Progress and Performance Mearement and Elion Case 13.3 Scanner Project You have been serving as Electroscan's project manager and are now well along the project. Develop a narrative status renort for the boand of directors of the cham store that discusses the status of the proiect to date (see Table C13.3) and at Con pletion. Be as specific as you can using numbers given and those you might develop. Remember, your audience is not familiar with the jargon used by project managers and computer software personnel; therefore, some explanation may be necessary. Your report will be evaluated on your detailed use of the data, your total perspec tive of the current status and future status of the project, and your recommended changes (if any). TABLE C13.3 Electroscan, Inc 555 Acom Street Sute5 Boston, Massachusetts 29 in store Scanner Propet thousands of dolars) Actual Progressas of Janury Name PV EV AC SV CV BAC EAC Scanner projest 420 295 476 -25 915 1103 H10 Hardware Hardware spectications (DS) Hardware design DS Hardware documentation DOC) 92 20 30 10 88 20 30 72 240 20 30 10 40 36 15 25 213 15 25 H12 H13 H14 Prototypes (PO) H15 21 40 Test prototypesU Order circuit boards PDI Preproduction models PD Operating system OP U Kermel specifications OS) H16 H17 30 25 30 30 25 30 100 330 20 70 40 20 240 100 50 60 30 200 20 20 100 20 40 125 10 50 20 15 30 100 431 15 97 60 OP 10 150 20 196 15 -45 195 20 45 25 20 130 30 45 55 46 26 45 31 -21 Drivers OP 121 OP 122 VO dvers DEV OP 13 OP 12 10 30 25 75 20 30 25 Disk drivers (DEV 15 -6 -30 -20 Code software OP 131 Code softwre (C OP 132 Document softwe DOC) OP 133 Code interfaces (C) OP 134 Beta test software (. Utlities U11 105 40 25 40 336 200 42 96 29 274 -10 15 -15 148 15 87 108 21 40 UtO 15 35 150 20 40 753 Utilites specifications (DS) Routine utilities DEV) 20 20 30 17 20 20 60 -15 U12 U13 Complex uities (DEV Uttes documentation DOC 30 -9 90 -10 U14 Beta test uies (T) -11 U15 System integration Architecture decisions OS 49 60 46 6. S10 75 20 12 30 $11 30 45 -15 25 $12 Integration hard'soft (DEV System hard'software test () Project documentation (DOC Integration acceptance testing0 -2 S13 $14 $415 12 10 Appendis Salui Seleed Eni 613 Teme . Total direct costs 2260 CPA:DH 3X Activites changed H. 2X 2X Time: 12 Total direct costs: 2460 CP-AD:DH A 3X 3X Activities changed C. H. 3. 2X 2X Direct Cost Indirect Cost Total Cost Duration 1,500 1,450 1,400 1,350 1,300 1,250 3,500 3,490 3,500 3,560 3,660 3,860 17 2,000 2,040 2.100 2,160 2,260 2,460 16 15 14 13 12 The optimum time-cost schedule would be 16 weeks at a cost of $3,490. Chapter 13 8. (S000) Status Report: Ending Period 1 % Complete AC PV CV SV Task EV 25% 25 50 50 -25 -25 Cumulative Totals 25 50 50 -25 -25 (S000) SV Status Report: Ending Period 2 CV Task % Complete EV AC PV 50% 50 100 100 -50 -50 Cumulative Totals 50 100 100 -50 -50 Append Selaions to Selected Esenies 613 3X Time Total direct costs 2240 3X 2. AB-FG Activties changet C. 3. 2X 2X Time 12 3X Total drect costs 240 CP ADH 3X 3X Activites changed C. 2X 2X Duration Direct Cost Indirect Cost Total Cost 3,500 2,000 2.040 2.100 1,500 1,450 1,400 1,350 17 3,490 16 15 3.500 2,160 2,260 2.460 3.560 1,660 14 13 1300 1,250 3.60 12 The optimum time-cost schedule would be 16 weeks a cost of $3.490. Chapter 13 8. Status Report: Ending Perlod 1 (S000) sComplete EV AC PV CV SV Task -25 -25 25% 25 50 50 -25 Cumulative Totals 25 50 50 -25 (S000) Status Report: Ending Perlod 2 Task EV PV CV SV Complete AC -50 -50 -50 S0% 50 100 100 Cumutative Totals 50 100 100 -50 614 Appendia 1 Soltions Selected Esercises ($000) Status Report: Ending Perlod 3 CV PV SV AC EV Task sComplete -100 200 100 100 -100 -150 100% 100 150 A. 350 -100 -250 100 200 Cumulative Totals (S00) Status Report: Ending Period 4 PV CV SV EV AC Task SComplete 100 -100 200 100 100% 100 150 300 550 50 25 150 60% 50% -75 225 475 200 500 -25 -75 Cumulative Totals (S000) Status Report: Ending Perlod 5 EV AC PV CV SV Task SComplete -100 50 100% 100 200 100 200 250 100% 100% 250 450 800 400 450 50 800 800 Cumulative Totals Status Report: Ending Period 6 (S000) Task SComplete EV AC PV CV SV 100% 100 200 100 -100 250 450 100 50 50 50 50 100% 250 200 100% 450 400 100 75% 150 50 Cumulative Totals 950 900 900 50 Status Report: Ending Period 7 (S000) Task S Complete EV AC PV CV SV 100% 100% 100 250 450 200 60 15 1075 200 100 -100 200 400 150 100 50 1100 250 50 50 100% 450 D. 100% 200 50 20% -40 -35 5% Cumulative Totals 15 1000 -25 75 20000 200O 78008 Appendix 1 Solutions to Selected Exercises 615 Status Report: Ending Period 8 (S000) Task % Complete CV SV EV AC PV 100% 100% 100% 100% -100 50 50 50 -50 -70 100 200 200 400 150 350 100 100 250 250 450 200 450 200 E 100% 300 100 -70 30 10% 30 1330 100 1300 rolec Cumulative Totals 1400 -70 Performance Indexes Summary Period EV AC PV SPI CPI PCIB 25 50 50 .50 .50 2% 50 100 100 .50 .50 3% .50 .95 100 200 350 29 5% 3 475 500 550 86 24% 40% 1.00 1.06 800 800 800 1.00 1.06 48% 900 1000 950 900 1.08 .98 54% 1075 1100 1330 1400 1300 1.02 .95 67% 8. (BAC - EV) (EVIAC) (2,000- 1,300) (1,330/1.400) + AC = + 1,400 = 2,105 EAC, = VAC, = BAC - EAC, = 2,000 – 2,105 = -105 %3D With two-thirds of the project completed the forecast is that the project will be $105,000 over budget at completion. 679 504 Chapter 3 Progress and Performance Mearement and Elion Case 13.3 Scanner Project You have been serving as Electroscan's project manager and are now well along the project. Develop a narrative status renort for the boand of directors of the cham store that discusses the status of the proiect to date (see Table C13.3) and at Con pletion. Be as specific as you can using numbers given and those you might develop. Remember, your audience is not familiar with the jargon used by project managers and computer software personnel; therefore, some explanation may be necessary. Your report will be evaluated on your detailed use of the data, your total perspec tive of the current status and future status of the project, and your recommended changes (if any). TABLE C13.3 Electroscan, Inc 555 Acom Street Sute5 Boston, Massachusetts 29 in store Scanner Propet thousands of dolars) Actual Progressas of Janury Name PV EV AC SV CV BAC EAC Scanner projest 420 295 476 -25 915 1103 H10 Hardware Hardware spectications (DS) Hardware design DS Hardware documentation DOC) 92 20 30 10 88 20 30 72 240 20 30 10 40 36 15 25 213 15 25 H12 H13 H14 Prototypes (PO) H15 21 40 Test prototypesU Order circuit boards PDI Preproduction models PD Operating system OP U Kermel specifications OS) H16 H17 30 25 30 30 25 30 100 330 20 70 40 20 240 100 50 60 30 200 20 20 100 20 40 125 10 50 20 15 30 100 431 15 97 60 OP 10 150 20 196 15 -45 195 20 45 25 20 130 30 45 55 46 26 45 31 -21 Drivers OP 121 OP 122 VO dvers DEV OP 13 OP 12 10 30 25 75 20 30 25 Disk drivers (DEV 15 -6 -30 -20 Code software OP 131 Code softwre (C OP 132 Document softwe DOC) OP 133 Code interfaces (C) OP 134 Beta test software (. Utlities U11 105 40 25 40 336 200 42 96 29 274 -10 15 -15 148 15 87 108 21 40 UtO 15 35 150 20 40 753 Utilites specifications (DS) Routine utilities DEV) 20 20 30 17 20 20 60 -15 U12 U13 Complex uities (DEV Uttes documentation DOC 30 -9 90 -10 U14 Beta test uies (T) -11 U15 System integration Architecture decisions OS 49 60 46 6. S10 75 20 12 30 $11 30 45 -15 25 $12 Integration hard'soft (DEV System hard'software test () Project documentation (DOC Integration acceptance testing0 -2 S13 $14 $415 12 10 Appendis Salui Seleed Eni 613 Teme . Total direct costs 2260 CPA:DH 3X Activites changed H. 2X 2X Time: 12 Total direct costs: 2460 CP-AD:DH A 3X 3X Activities changed C. H. 3. 2X 2X Direct Cost Indirect Cost Total Cost Duration 1,500 1,450 1,400 1,350 1,300 1,250 3,500 3,490 3,500 3,560 3,660 3,860 17 2,000 2,040 2.100 2,160 2,260 2,460 16 15 14 13 12 The optimum time-cost schedule would be 16 weeks at a cost of $3,490. Chapter 13 8. (S000) Status Report: Ending Period 1 % Complete AC PV CV SV Task EV 25% 25 50 50 -25 -25 Cumulative Totals 25 50 50 -25 -25 (S000) SV Status Report: Ending Period 2 CV Task % Complete EV AC PV 50% 50 100 100 -50 -50 Cumulative Totals 50 100 100 -50 -50 Append Selaions to Selected Esenies 613 3X Time Total direct costs 2240 3X 2. AB-FG Activties changet C. 3. 2X 2X Time 12 3X Total drect costs 240 CP ADH 3X 3X Activites changed C. 2X 2X Duration Direct Cost Indirect Cost Total Cost 3,500 2,000 2.040 2.100 1,500 1,450 1,400 1,350 17 3,490 16 15 3.500 2,160 2,260 2.460 3.560 1,660 14 13 1300 1,250 3.60 12 The optimum time-cost schedule would be 16 weeks a cost of $3.490. Chapter 13 8. Status Report: Ending Perlod 1 (S000) sComplete EV AC PV CV SV Task -25 -25 25% 25 50 50 -25 Cumulative Totals 25 50 50 -25 (S000) Status Report: Ending Perlod 2 Task EV PV CV SV Complete AC -50 -50 -50 S0% 50 100 100 Cumutative Totals 50 100 100 -50 614 Appendia 1 Soltions Selected Esercises ($000) Status Report: Ending Perlod 3 CV PV SV AC EV Task sComplete -100 200 100 100 -100 -150 100% 100 150 A. 350 -100 -250 100 200 Cumulative Totals (S00) Status Report: Ending Period 4 PV CV SV EV AC Task SComplete 100 -100 200 100 100% 100 150 300 550 50 25 150 60% 50% -75 225 475 200 500 -25 -75 Cumulative Totals (S000) Status Report: Ending Perlod 5 EV AC PV CV SV Task SComplete -100 50 100% 100 200 100 200 250 100% 100% 250 450 800 400 450 50 800 800 Cumulative Totals Status Report: Ending Period 6 (S000) Task SComplete EV AC PV CV SV 100% 100 200 100 -100 250 450 100 50 50 50 50 100% 250 200 100% 450 400 100 75% 150 50 Cumulative Totals 950 900 900 50 Status Report: Ending Period 7 (S000) Task S Complete EV AC PV CV SV 100% 100% 100 250 450 200 60 15 1075 200 100 -100 200 400 150 100 50 1100 250 50 50 100% 450 D. 100% 200 50 20% -40 -35 5% Cumulative Totals 15 1000 -25 75 20000 200O 78008 Appendix 1 Solutions to Selected Exercises 615 Status Report: Ending Period 8 (S000) Task % Complete CV SV EV AC PV 100% 100% 100% 100% -100 50 50 50 -50 -70 100 200 200 400 150 350 100 100 250 250 450 200 450 200 E 100% 300 100 -70 30 10% 30 1330 100 1300 rolec Cumulative Totals 1400 -70 Performance Indexes Summary Period EV AC PV SPI CPI PCIB 25 50 50 .50 .50 2% 50 100 100 .50 .50 3% .50 .95 100 200 350 29 5% 3 475 500 550 86 24% 40% 1.00 1.06 800 800 800 1.00 1.06 48% 900 1000 950 900 1.08 .98 54% 1075 1100 1330 1400 1300 1.02 .95 67% 8. (BAC - EV) (EVIAC) (2,000- 1,300) (1,330/1.400) + AC = + 1,400 = 2,105 EAC, = VAC, = BAC - EAC, = 2,000 – 2,105 = -105 %3D With two-thirds of the project completed the forecast is that the project will be $105,000 over budget at completion. 679 504 Chapter 3 Progress and Performance Mearement and Elion Case 13.3 Scanner Project You have been serving as Electroscan's project manager and are now well along the project. Develop a narrative status renort for the boand of directors of the cham store that discusses the status of the proiect to date (see Table C13.3) and at Con pletion. Be as specific as you can using numbers given and those you might develop. Remember, your audience is not familiar with the jargon used by project managers and computer software personnel; therefore, some explanation may be necessary. Your report will be evaluated on your detailed use of the data, your total perspec tive of the current status and future status of the project, and your recommended changes (if any). TABLE C13.3 Electroscan, Inc 555 Acom Street Sute5 Boston, Massachusetts 29 in store Scanner Propet thousands of dolars) Actual Progressas of Janury Name PV EV AC SV CV BAC EAC Scanner projest 420 295 476 -25 915 1103 H10 Hardware Hardware spectications (DS) Hardware design DS Hardware documentation DOC) 92 20 30 10 88 20 30 72 240 20 30 10 40 36 15 25 213 15 25 H12 H13 H14 Prototypes (PO) H15 21 40 Test prototypesU Order circuit boards PDI Preproduction models PD Operating system OP U Kermel specifications OS) H16 H17 30 25 30 30 25 30 100 330 20 70 40 20 240 100 50 60 30 200 20 20 100 20 40 125 10 50 20 15 30 100 431 15 97 60 OP 10 150 20 196 15 -45 195 20 45 25 20 130 30 45 55 46 26 45 31 -21 Drivers OP 121 OP 122 VO dvers DEV OP 13 OP 12 10 30 25 75 20 30 25 Disk drivers (DEV 15 -6 -30 -20 Code software OP 131 Code softwre (C OP 132 Document softwe DOC) OP 133 Code interfaces (C) OP 134 Beta test software (. Utlities U11 105 40 25 40 336 200 42 96 29 274 -10 15 -15 148 15 87 108 21 40 UtO 15 35 150 20 40 753 Utilites specifications (DS) Routine utilities DEV) 20 20 30 17 20 20 60 -15 U12 U13 Complex uities (DEV Uttes documentation DOC 30 -9 90 -10 U14 Beta test uies (T) -11 U15 System integration Architecture decisions OS 49 60 46 6. S10 75 20 12 30 $11 30 45 -15 25 $12 Integration hard'soft (DEV System hard'software test () Project documentation (DOC Integration acceptance testing0 -2 S13 $14 $415 12 10 Appendis Salui Seleed Eni 613 Teme . Total direct costs 2260 CPA:DH 3X Activites changed H. 2X 2X Time: 12 Total direct costs: 2460 CP-AD:DH A 3X 3X Activities changed C. H. 3. 2X 2X Direct Cost Indirect Cost Total Cost Duration 1,500 1,450 1,400 1,350 1,300 1,250 3,500 3,490 3,500 3,560 3,660 3,860 17 2,000 2,040 2.100 2,160 2,260 2,460 16 15 14 13 12 The optimum time-cost schedule would be 16 weeks at a cost of $3,490. Chapter 13 8. (S000) Status Report: Ending Period 1 % Complete AC PV CV SV Task EV 25% 25 50 50 -25 -25 Cumulative Totals 25 50 50 -25 -25 (S000) SV Status Report: Ending Period 2 CV Task % Complete EV AC PV 50% 50 100 100 -50 -50 Cumulative Totals 50 100 100 -50 -50 Append Selaions to Selected Esenies 613 3X Time Total direct costs 2240 3X 2. AB-FG Activties changet C. 3. 2X 2X Time 12 3X Total drect costs 240 CP ADH 3X 3X Activites changed C. 2X 2X Duration Direct Cost Indirect Cost Total Cost 3,500 2,000 2.040 2.100 1,500 1,450 1,400 1,350 17 3,490 16 15 3.500 2,160 2,260 2.460 3.560 1,660 14 13 1300 1,250 3.60 12 The optimum time-cost schedule would be 16 weeks a cost of $3.490. Chapter 13 8. Status Report: Ending Perlod 1 (S000) sComplete EV AC PV CV SV Task -25 -25 25% 25 50 50 -25 Cumulative Totals 25 50 50 -25 (S000) Status Report: Ending Perlod 2 Task EV PV CV SV Complete AC -50 -50 -50 S0% 50 100 100 Cumutative Totals 50 100 100 -50 614 Appendia 1 Soltions Selected Esercises ($000) Status Report: Ending Perlod 3 CV PV SV AC EV Task sComplete -100 200 100 100 -100 -150 100% 100 150 A. 350 -100 -250 100 200 Cumulative Totals (S00) Status Report: Ending Period 4 PV CV SV EV AC Task SComplete 100 -100 200 100 100% 100 150 300 550 50 25 150 60% 50% -75 225 475 200 500 -25 -75 Cumulative Totals (S000) Status Report: Ending Perlod 5 EV AC PV CV SV Task SComplete -100 50 100% 100 200 100 200 250 100% 100% 250 450 800 400 450 50 800 800 Cumulative Totals Status Report: Ending Period 6 (S000) Task SComplete EV AC PV CV SV 100% 100 200 100 -100 250 450 100 50 50 50 50 100% 250 200 100% 450 400 100 75% 150 50 Cumulative Totals 950 900 900 50 Status Report: Ending Period 7 (S000) Task S Complete EV AC PV CV SV 100% 100% 100 250 450 200 60 15 1075 200 100 -100 200 400 150 100 50 1100 250 50 50 100% 450 D. 100% 200 50 20% -40 -35 5% Cumulative Totals 15 1000 -25 75 20000 200O 78008 Appendix 1 Solutions to Selected Exercises 615 Status Report: Ending Period 8 (S000) Task % Complete CV SV EV AC PV 100% 100% 100% 100% -100 50 50 50 -50 -70 100 200 200 400 150 350 100 100 250 250 450 200 450 200 E 100% 300 100 -70 30 10% 30 1330 100 1300 rolec Cumulative Totals 1400 -70 Performance Indexes Summary Period EV AC PV SPI CPI PCIB 25 50 50 .50 .50 2% 50 100 100 .50 .50 3% .50 .95 100 200 350 29 5% 3 475 500 550 86 24% 40% 1.00 1.06 800 800 800 1.00 1.06 48% 900 1000 950 900 1.08 .98 54% 1075 1100 1330 1400 1300 1.02 .95 67% 8. (BAC - EV) (EVIAC) (2,000- 1,300) (1,330/1.400) + AC = + 1,400 = 2,105 EAC, = VAC, = BAC - EAC, = 2,000 – 2,105 = -105 %3D With two-thirds of the project completed the forecast is that the project will be $105,000 over budget at completion. 679 504 Chapter 3 Progress and Performance Mearement and Elion Case 13.3 Scanner Project You have been serving as Electroscan's project manager and are now well along the project. Develop a narrative status renort for the boand of directors of the cham store that discusses the status of the proiect to date (see Table C13.3) and at Con pletion. Be as specific as you can using numbers given and those you might develop. Remember, your audience is not familiar with the jargon used by project managers and computer software personnel; therefore, some explanation may be necessary. Your report will be evaluated on your detailed use of the data, your total perspec tive of the current status and future status of the project, and your recommended changes (if any). TABLE C13.3 Electroscan, Inc 555 Acom Street Sute5 Boston, Massachusetts 29 in store Scanner Propet thousands of dolars) Actual Progressas of Janury Name PV EV AC SV CV BAC EAC Scanner projest 420 295 476 -25 915 1103 H10 Hardware Hardware spectications (DS) Hardware design DS Hardware documentation DOC) 92 20 30 10 88 20 30 72 240 20 30 10 40 36 15 25 213 15 25 H12 H13 H14 Prototypes (PO) H15 21 40 Test prototypesU Order circuit boards PDI Preproduction models PD Operating system OP U Kermel specifications OS) H16 H17 30 25 30 30 25 30 100 330 20 70 40 20 240 100 50 60 30 200 20 20 100 20 40 125 10 50 20 15 30 100 431 15 97 60 OP 10 150 20 196 15 -45 195 20 45 25 20 130 30 45 55 46 26 45 31 -21 Drivers OP 121 OP 122 VO dvers DEV OP 13 OP 12 10 30 25 75 20 30 25 Disk drivers (DEV 15 -6 -30 -20 Code software OP 131 Code softwre (C OP 132 Document softwe DOC) OP 133 Code interfaces (C) OP 134 Beta test software (. Utlities U11 105 40 25 40 336 200 42 96 29 274 -10 15 -15 148 15 87 108 21 40 UtO 15 35 150 20 40 753 Utilites specifications (DS) Routine utilities DEV) 20 20 30 17 20 20 60 -15 U12 U13 Complex uities (DEV Uttes documentation DOC 30 -9 90 -10 U14 Beta test uies (T) -11 U15 System integration Architecture decisions OS 49 60 46 6. S10 75 20 12 30 $11 30 45 -15 25 $12 Integration hard'soft (DEV System hard'software test () Project documentation (DOC Integration acceptance testing0 -2 S13 $14 $415 12 10 Appendis Salui Seleed Eni 613 Teme . Total direct costs 2260 CPA:DH 3X Activites changed H. 2X 2X Time: 12 Total direct costs: 2460 CP-AD:DH A 3X 3X Activities changed C. H. 3. 2X 2X Direct Cost Indirect Cost Total Cost Duration 1,500 1,450 1,400 1,350 1,300 1,250 3,500 3,490 3,500 3,560 3,660 3,860 17 2,000 2,040 2.100 2,160 2,260 2,460 16 15 14 13 12 The optimum time-cost schedule would be 16 weeks at a cost of $3,490. Chapter 13 8. (S000) Status Report: Ending Period 1 % Complete AC PV CV SV Task EV 25% 25 50 50 -25 -25 Cumulative Totals 25 50 50 -25 -25 (S000) SV Status Report: Ending Period 2 CV Task % Complete EV AC PV 50% 50 100 100 -50 -50 Cumulative Totals 50 100 100 -50 -50 Append Selaions to Selected Esenies 613 3X Time Total direct costs 2240 3X 2. AB-FG Activties changet C. 3. 2X 2X Time 12 3X Total drect costs 240 CP ADH 3X 3X Activites changed C. 2X 2X Duration Direct Cost Indirect Cost Total Cost 3,500 2,000 2.040 2.100 1,500 1,450 1,400 1,350 17 3,490 16 15 3.500 2,160 2,260 2.460 3.560 1,660 14 13 1300 1,250 3.60 12 The optimum time-cost schedule would be 16 weeks a cost of $3.490. Chapter 13 8. Status Report: Ending Perlod 1 (S000) sComplete EV AC PV CV SV Task -25 -25 25% 25 50 50 -25 Cumulative Totals 25 50 50 -25 (S000) Status Report: Ending Perlod 2 Task EV PV CV SV Complete AC -50 -50 -50 S0% 50 100 100 Cumutative Totals 50 100 100 -50 614 Appendia 1 Soltions Selected Esercises ($000) Status Report: Ending Perlod 3 CV PV SV AC EV Task sComplete -100 200 100 100 -100 -150 100% 100 150 A. 350 -100 -250 100 200 Cumulative Totals (S00) Status Report: Ending Period 4 PV CV SV EV AC Task SComplete 100 -100 200 100 100% 100 150 300 550 50 25 150 60% 50% -75 225 475 200 500 -25 -75 Cumulative Totals (S000) Status Report: Ending Perlod 5 EV AC PV CV SV Task SComplete -100 50 100% 100 200 100 200 250 100% 100% 250 450 800 400 450 50 800 800 Cumulative Totals Status Report: Ending Period 6 (S000) Task SComplete EV AC PV CV SV 100% 100 200 100 -100 250 450 100 50 50 50 50 100% 250 200 100% 450 400 100 75% 150 50 Cumulative Totals 950 900 900 50 Status Report: Ending Period 7 (S000) Task S Complete EV AC PV CV SV 100% 100% 100 250 450 200 60 15 1075 200 100 -100 200 400 150 100 50 1100 250 50 50 100% 450 D. 100% 200 50 20% -40 -35 5% Cumulative Totals 15 1000 -25 75 20000 200O 78008 Appendix 1 Solutions to Selected Exercises 615 Status Report: Ending Period 8 (S000) Task % Complete CV SV EV AC PV 100% 100% 100% 100% -100 50 50 50 -50 -70 100 200 200 400 150 350 100 100 250 250 450 200 450 200 E 100% 300 100 -70 30 10% 30 1330 100 1300 rolec Cumulative Totals 1400 -70 Performance Indexes Summary Period EV AC PV SPI CPI PCIB 25 50 50 .50 .50 2% 50 100 100 .50 .50 3% .50 .95 100 200 350 29 5% 3 475 500 550 86 24% 40% 1.00 1.06 800 800 800 1.00 1.06 48% 900 1000 950 900 1.08 .98 54% 1075 1100 1330 1400 1300 1.02 .95 67% 8. (BAC - EV) (EVIAC) (2,000- 1,300) (1,330/1.400) + AC = + 1,400 = 2,105 EAC, = VAC, = BAC - EAC, = 2,000 – 2,105 = -105 %3D With two-thirds of the project completed the forecast is that the project will be $105,000 over budget at completion. 679 504 Chapter 3 Progress and Performance Mearement and Elion Case 13.3 Scanner Project You have been serving as Electroscan's project manager and are now well along the project. Develop a narrative status renort for the boand of directors of the cham store that discusses the status of the proiect to date (see Table C13.3) and at Con pletion. Be as specific as you can using numbers given and those you might develop. Remember, your audience is not familiar with the jargon used by project managers and computer software personnel; therefore, some explanation may be necessary. Your report will be evaluated on your detailed use of the data, your total perspec tive of the current status and future status of the project, and your recommended changes (if any). TABLE C13.3 Electroscan, Inc 555 Acom Street Sute5 Boston, Massachusetts 29 in store Scanner Propet thousands of dolars) Actual Progressas of Janury Name PV EV AC SV CV BAC EAC Scanner projest 420 295 476 -25 915 1103 H10 Hardware Hardware spectications (DS) Hardware design DS Hardware documentation DOC) 92 20 30 10 88 20 30 72 240 20 30 10 40 36 15 25 213 15 25 H12 H13 H14 Prototypes (PO) H15 21 40 Test prototypesU Order circuit boards PDI Preproduction models PD Operating system OP U Kermel specifications OS) H16 H17 30 25 30 30 25 30 100 330 20 70 40 20 240 100 50 60 30 200 20 20 100 20 40 125 10 50 20 15 30 100 431 15 97 60 OP 10 150 20 196 15 -45 195 20 45 25 20 130 30 45 55 46 26 45 31 -21 Drivers OP 121 OP 122 VO dvers DEV OP 13 OP 12 10 30 25 75 20 30 25 Disk drivers (DEV 15 -6 -30 -20 Code software OP 131 Code softwre (C OP 132 Document softwe DOC) OP 133 Code interfaces (C) OP 134 Beta test software (. Utlities U11 105 40 25 40 336 200 42 96 29 274 -10 15 -15 148 15 87 108 21 40 UtO 15 35 150 20 40 753 Utilites specifications (DS) Routine utilities DEV) 20 20 30 17 20 20 60 -15 U12 U13 Complex uities (DEV Uttes documentation DOC 30 -9 90 -10 U14 Beta test uies (T) -11 U15 System integration Architecture decisions OS 49 60 46 6. S10 75 20 12 30 $11 30 45 -15 25 $12 Integration hard'soft (DEV System hard'software test () Project documentation (DOC Integration acceptance testing0 -2 S13 $14 $415 12 10 Appendis Salui Seleed Eni 613 Teme . Total direct costs 2260 CPA:DH 3X Activites changed H. 2X 2X Time: 12 Total direct costs: 2460 CP-AD:DH A 3X 3X Activities changed C. H. 3. 2X 2X Direct Cost Indirect Cost Total Cost Duration 1,500 1,450 1,400 1,350 1,300 1,250 3,500 3,490 3,500 3,560 3,660 3,860 17 2,000 2,040 2.100 2,160 2,260 2,460 16 15 14 13 12 The optimum time-cost schedule would be 16 weeks at a cost of $3,490. Chapter 13 8. (S000) Status Report: Ending Period 1 % Complete AC PV CV SV Task EV 25% 25 50 50 -25 -25 Cumulative Totals 25 50 50 -25 -25 (S000) SV Status Report: Ending Period 2 CV Task % Complete EV AC PV 50% 50 100 100 -50 -50 Cumulative Totals 50 100 100 -50 -50 Append Selaions to Selected Esenies 613 3X Time Total direct costs 2240 3X 2. AB-FG Activties changet C. 3. 2X 2X Time 12 3X Total drect costs 240 CP ADH 3X 3X Activites changed C. 2X 2X Duration Direct Cost Indirect Cost Total Cost 3,500 2,000 2.040 2.100 1,500 1,450 1,400 1,350 17 3,490 16 15 3.500 2,160 2,260 2.460 3.560 1,660 14 13 1300 1,250 3.60 12 The optimum time-cost schedule would be 16 weeks a cost of $3.490. Chapter 13 8. Status Report: Ending Perlod 1 (S000) sComplete EV AC PV CV SV Task -25 -25 25% 25 50 50 -25 Cumulative Totals 25 50 50 -25 (S000) Status Report: Ending Perlod 2 Task EV PV CV SV Complete AC -50 -50 -50 S0% 50 100 100 Cumutative Totals 50 100 100 -50 614 Appendia 1 Soltions Selected Esercises ($000) Status Report: Ending Perlod 3 CV PV SV AC EV Task sComplete -100 200 100 100 -100 -150 100% 100 150 A. 350 -100 -250 100 200 Cumulative Totals (S00) Status Report: Ending Period 4 PV CV SV EV AC Task SComplete 100 -100 200 100 100% 100 150 300 550 50 25 150 60% 50% -75 225 475 200 500 -25 -75 Cumulative Totals (S000) Status Report: Ending Perlod 5 EV AC PV CV SV Task SComplete -100 50 100% 100 200 100 200 250 100% 100% 250 450 800 400 450 50 800 800 Cumulative Totals Status Report: Ending Period 6 (S000) Task SComplete EV AC PV CV SV 100% 100 200 100 -100 250 450 100 50 50 50 50 100% 250 200 100% 450 400 100 75% 150 50 Cumulative Totals 950 900 900 50 Status Report: Ending Period 7 (S000) Task S Complete EV AC PV CV SV 100% 100% 100 250 450 200 60 15 1075 200 100 -100 200 400 150 100 50 1100 250 50 50 100% 450 D. 100% 200 50 20% -40 -35 5% Cumulative Totals 15 1000 -25 75 20000 200O 78008 Appendix 1 Solutions to Selected Exercises 615 Status Report: Ending Period 8 (S000) Task % Complete CV SV EV AC PV 100% 100% 100% 100% -100 50 50 50 -50 -70 100 200 200 400 150 350 100 100 250 250 450 200 450 200 E 100% 300 100 -70 30 10% 30 1330 100 1300 rolec Cumulative Totals 1400 -70 Performance Indexes Summary Period EV AC PV SPI CPI PCIB 25 50 50 .50 .50 2% 50 100 100 .50 .50 3% .50 .95 100 200 350 29 5% 3 475 500 550 86 24% 40% 1.00 1.06 800 800 800 1.00 1.06 48% 900 1000 950 900 1.08 .98 54% 1075 1100 1330 1400 1300 1.02 .95 67% 8. (BAC - EV) (EVIAC) (2,000- 1,300) (1,330/1.400) + AC = + 1,400 = 2,105 EAC, = VAC, = BAC - EAC, = 2,000 – 2,105 = -105 %3D With two-thirds of the project completed the forecast is that the project will be $105,000 over budget at completion. 679 504 Chapter 3 Progress and Performance Mearement and Elion Case 13.3 Scanner Project You have been serving as Electroscan's project manager and are now well along the project. Develop a narrative status renort for the boand of directors of the cham store that discusses the status of the proiect to date (see Table C13.3) and at Con pletion. Be as specific as you can using numbers given and those you might develop. Remember, your audience is not familiar with the jargon used by project managers and computer software personnel; therefore, some explanation may be necessary. Your report will be evaluated on your detailed use of the data, your total perspec tive of the current status and future status of the project, and your recommended changes (if any). TABLE C13.3 Electroscan, Inc 555 Acom Street Sute5 Boston, Massachusetts 29 in store Scanner Propet thousands of dolars) Actual Progressas of Janury Name PV EV AC SV CV BAC EAC Scanner projest 420 295 476 -25 915 1103 H10 Hardware Hardware spectications (DS) Hardware design DS Hardware documentation DOC) 92 20 30 10 88 20 30 72 240 20 30 10 40 36 15 25 213 15 25 H12 H13 H14 Prototypes (PO) H15 21 40 Test prototypesU Order circuit boards PDI Preproduction models PD Operating system OP U Kermel specifications OS) H16 H17 30 25 30 30 25 30 100 330 20 70 40 20 240 100 50 60 30 200 20 20 100 20 40 125 10 50 20 15 30 100 431 15 97 60 OP 10 150 20 196 15 -45 195 20 45 25 20 130 30 45 55 46 26 45 31 -21 Drivers OP 121 OP 122 VO dvers DEV OP 13 OP 12 10 30 25 75 20 30 25 Disk drivers (DEV 15 -6 -30 -20 Code software OP 131 Code softwre (C OP 132 Document softwe DOC) OP 133 Code interfaces (C) OP 134 Beta test software (. Utlities U11 105 40 25 40 336 200 42 96 29 274 -10 15 -15 148 15 87 108 21 40 UtO 15 35 150 20 40 753 Utilites specifications (DS) Routine utilities DEV) 20 20 30 17 20 20 60 -15 U12 U13 Complex uities (DEV Uttes documentation DOC 30 -9 90 -10 U14 Beta test uies (T) -11 U15 System integration Architecture decisions OS 49 60 46 6. S10 75 20 12 30 $11 30 45 -15 25 $12 Integration hard'soft (DEV System hard'software test () Project documentation (DOC Integration acceptance testing0 -2 S13 $14 $415 12 10 Appendis Salui Seleed Eni 613 Teme . Total direct costs 2260 CPA:DH 3X Activites changed H. 2X 2X Time: 12 Total direct costs: 2460 CP-AD:DH A 3X 3X Activities changed C. H. 3. 2X 2X Direct Cost Indirect Cost Total Cost Duration 1,500 1,450 1,400 1,350 1,300 1,250 3,500 3,490 3,500 3,560 3,660 3,860 17 2,000 2,040 2.100 2,160 2,260 2,460 16 15 14 13 12 The optimum time-cost schedule would be 16 weeks at a cost of $3,490. Chapter 13 8. (S000) Status Report: Ending Period 1 % Complete AC PV CV SV Task EV 25% 25 50 50 -25 -25 Cumulative Totals 25 50 50 -25 -25 (S000) SV Status Report: Ending Period 2 CV Task % Complete EV AC PV 50% 50 100 100 -50 -50 Cumulative Totals 50 100 100 -50 -50 Append Selaions to Selected Esenies 613 3X Time Total direct costs 2240 3X 2. AB-FG Activties changet C. 3. 2X 2X Time 12 3X Total drect costs 240 CP ADH 3X 3X Activites changed C. 2X 2X Duration Direct Cost Indirect Cost Total Cost 3,500 2,000 2.040 2.100 1,500 1,450 1,400 1,350 17 3,490 16 15 3.500 2,160 2,260 2.460 3.560 1,660 14 13 1300 1,250 3.60 12 The optimum time-cost schedule would be 16 weeks a cost of $3.490. Chapter 13 8. Status Report: Ending Perlod 1 (S000) sComplete EV AC PV CV SV Task -25 -25 25% 25 50 50 -25 Cumulative Totals 25 50 50 -25 (S000) Status Report: Ending Perlod 2 Task EV PV CV SV Complete AC -50 -50 -50 S0% 50 100 100 Cumutative Totals 50 100 100 -50 614 Appendia 1 Soltions Selected Esercises ($000) Status Report: Ending Perlod 3 CV PV SV AC EV Task sComplete -100 200 100 100 -100 -150 100% 100 150 A. 350 -100 -250 100 200 Cumulative Totals (S00) Status Report: Ending Period 4 PV CV SV EV AC Task SComplete 100 -100 200 100 100% 100 150 300 550 50 25 150 60% 50% -75 225 475 200 500 -25 -75 Cumulative Totals (S000) Status Report: Ending Perlod 5 EV AC PV CV SV Task SComplete -100 50 100% 100 200 100 200 250 100% 100% 250 450 800 400 450 50 800 800 Cumulative Totals Status Report: Ending Period 6 (S000) Task SComplete EV AC PV CV SV 100% 100 200 100 -100 250 450 100 50 50 50 50 100% 250 200 100% 450 400 100 75% 150 50 Cumulative Totals 950 900 900 50 Status Report: Ending Period 7 (S000) Task S Complete EV AC PV CV SV 100% 100% 100 250 450 200 60 15 1075 200 100 -100 200 400 150 100 50 1100 250 50 50 100% 450 D. 100% 200 50 20% -40 -35 5% Cumulative Totals 15 1000 -25 75 20000 200O 78008 Appendix 1 Solutions to Selected Exercises 615 Status Report: Ending Period 8 (S000) Task % Complete CV SV EV AC PV 100% 100% 100% 100% -100 50 50 50 -50 -70 100 200 200 400 150 350 100 100 250 250 450 200 450 200 E 100% 300 100 -70 30 10% 30 1330 100 1300 rolec Cumulative Totals 1400 -70 Performance Indexes Summary Period EV AC PV SPI CPI PCIB 25 50 50 .50 .50 2% 50 100 100 .50 .50 3% .50 .95 100 200 350 29 5% 3 475 500 550 86 24% 40% 1.00 1.06 800 800 800 1.00 1.06 48% 900 1000 950 900 1.08 .98 54% 1075 1100 1330 1400 1300 1.02 .95 67% 8. (BAC - EV) (EVIAC) (2,000- 1,300) (1,330/1.400) + AC = + 1,400 = 2,105 EAC, = VAC, = BAC - EAC, = 2,000 – 2,105 = -105 %3D With two-thirds of the project completed the forecast is that the project will be $105,000 over budget at completion. 679 504 Chapter 3 Progress and Performance Mearement and Elion Case 13.3 Scanner Project You have been serving as Electroscan's project manager and are now well along the project. Develop a narrative status renort for the boand of directors of the cham store that discusses the status of the proiect to date (see Table C13.3) and at Con pletion. Be as specific as you can using numbers given and those you might develop. Remember, your audience is not familiar with the jargon used by project managers and computer software personnel; therefore, some explanation may be necessary. Your report will be evaluated on your detailed use of the data, your total perspec tive of the current status and future status of the project, and your recommended changes (if any). TABLE C13.3 Electroscan, Inc 555 Acom Street Sute5 Boston, Massachusetts 29 in store Scanner Propet thousands of dolars) Actual Progressas of Janury Name PV EV AC SV CV BAC EAC Scanner projest 420 295 476 -25 915 1103 H10 Hardware Hardware spectications (DS) Hardware design DS Hardware documentation DOC) 92 20 30 10 88 20 30 72 240 20 30 10 40 36 15 25 213 15 25 H12 H13 H14 Prototypes (PO) H15 21 40 Test prototypesU Order circuit boards PDI Preproduction models PD Operating system OP U Kermel specifications OS) H16 H17 30 25 30 30 25 30 100 330 20 70 40 20 240 100 50 60 30 200 20 20 100 20 40 125 10 50 20 15 30 100 431 15 97 60 OP 10 150 20 196 15 -45 195 20 45 25 20 130 30 45 55 46 26 45 31 -21 Drivers OP 121 OP 122 VO dvers DEV OP 13 OP 12 10 30 25 75 20 30 25 Disk drivers (DEV 15 -6 -30 -20 Code software OP 131 Code softwre (C OP 132 Document softwe DOC) OP 133 Code interfaces (C) OP 134 Beta test software (. Utlities U11 105 40 25 40 336 200 42 96 29 274 -10 15 -15 148 15 87 108 21 40 UtO 15 35 150 20 40 753 Utilites specifications (DS) Routine utilities DEV) 20 20 30 17 20 20 60 -15 U12 U13 Complex uities (DEV Uttes documentation DOC 30 -9 90 -10 U14 Beta test uies (T) -11 U15 System integration Architecture decisions OS 49 60 46 6. S10 75 20 12 30 $11 30 45 -15 25 $12 Integration hard'soft (DEV System hard'software test () Project documentation (DOC Integration acceptance testing0 -2 S13 $14 $415 12 10 Appendis Salui Seleed Eni 613 Teme . Total direct costs 2260 CPA:DH 3X Activites changed H. 2X 2X Time: 12 Total direct costs: 2460 CP-AD:DH A 3X 3X Activities changed C. H. 3. 2X 2X Direct Cost Indirect Cost Total Cost Duration 1,500 1,450 1,400 1,350 1,300 1,250 3,500 3,490 3,500 3,560 3,660 3,860 17 2,000 2,040 2.100 2,160 2,260 2,460 16 15 14 13 12 The optimum time-cost schedule would be 16 weeks at a cost of $3,490. Chapter 13 8. (S000) Status Report: Ending Period 1 % Complete AC PV CV SV Task EV 25% 25 50 50 -25 -25 Cumulative Totals 25 50 50 -25 -25 (S000) SV Status Report: Ending Period 2 CV Task % Complete EV AC PV 50% 50 100 100 -50 -50 Cumulative Totals 50 100 100 -50 -50 Append Selaions to Selected Esenies 613 3X Time Total direct costs 2240 3X 2. AB-FG Activties changet C. 3. 2X 2X Time 12 3X Total drect costs 240 CP ADH 3X 3X Activites changed C. 2X 2X Duration Direct Cost Indirect Cost Total Cost 3,500 2,000 2.040 2.100 1,500 1,450 1,400 1,350 17 3,490 16 15 3.500 2,160 2,260 2.460 3.560 1,660 14 13 1300 1,250 3.60 12 The optimum time-cost schedule would be 16 weeks a cost of $3.490. Chapter 13 8. Status Report: Ending Perlod 1 (S000) sComplete EV AC PV CV SV Task -25 -25 25% 25 50 50 -25 Cumulative Totals 25 50 50 -25 (S000) Status Report: Ending Perlod 2 Task EV PV CV SV Complete AC -50 -50 -50 S0% 50 100 100 Cumutative Totals 50 100 100 -50 614 Appendia 1 Soltions Selected Esercises ($000) Status Report: Ending Perlod 3 CV PV SV AC EV Task sComplete -100 200 100 100 -100 -150 100% 100 150 A. 350 -100 -250 100 200 Cumulative Totals (S00) Status Report: Ending Period 4 PV CV SV EV AC Task SComplete 100 -100 200 100 100% 100 150 300 550 50 25 150 60% 50% -75 225 475 200 500 -25 -75 Cumulative Totals (S000) Status Report: Ending Perlod 5 EV AC PV CV SV Task SComplete -100 50 100% 100 200 100 200 250 100% 100% 250 450 800 400 450 50 800 800 Cumulative Totals Status Report: Ending Period 6 (S000) Task SComplete EV AC PV CV SV 100% 100 200 100 -100 250 450 100 50 50 50 50 100% 250 200 100% 450 400 100 75% 150 50 Cumulative Totals 950 900 900 50 Status Report: Ending Period 7 (S000) Task S Complete EV AC PV CV SV 100% 100% 100 250 450 200 60 15 1075 200 100 -100 200 400 150 100 50 1100 250 50 50 100% 450 D. 100% 200 50 20% -40 -35 5% Cumulative Totals 15 1000 -25 75 20000 200O 78008 Appendix 1 Solutions to Selected Exercises 615 Status Report: Ending Period 8 (S000) Task % Complete CV SV EV AC PV 100% 100% 100% 100% -100 50 50 50 -50 -70 100 200 200 400 150 350 100 100 250 250 450 200 450 200 E 100% 300 100 -70 30 10% 30 1330 100 1300 rolec Cumulative Totals 1400 -70 Performance Indexes Summary Period EV AC PV SPI CPI PCIB 25 50 50 .50 .50 2% 50 100 100 .50 .50 3% .50 .95 100 200 350 29 5% 3 475 500 550 86 24% 40% 1.00 1.06 800 800 800 1.00 1.06 48% 900 1000 950 900 1.08 .98 54% 1075 1100 1330 1400 1300 1.02 .95 67% 8. (BAC - EV) (EVIAC) (2,000- 1,300) (1,330/1.400) + AC = + 1,400 = 2,105 EAC, = VAC, = BAC - EAC, = 2,000 – 2,105 = -105 %3D With two-thirds of the project completed the forecast is that the project will be $105,000 over budget at completion. 679 504 Chapter 3 Progress and Performance Mearement and Elion Case 13.3 Scanner Project You have been serving as Electroscan's project manager and are now well along the project. Develop a narrative status renort for the boand of directors of the cham store that discusses the status of the proiect to date (see Table C13.3) and at Con pletion. Be as specific as you can using numbers given and those you might develop. Remember, your audience is not familiar with the jargon used by project managers and computer software personnel; therefore, some explanation may be necessary. Your report will be evaluated on your detailed use of the data, your total perspec tive of the current status and future status of the project, and your recommended changes (if any). TABLE C13.3 Electroscan, Inc 555 Acom Street Sute5 Boston, Massachusetts 29 in store Scanner Propet thousands of dolars) Actual Progressas of Janury Name PV EV AC SV CV BAC EAC Scanner projest 420 295 476 -25 915 1103 H10 Hardware Hardware spectications (DS) Hardware design DS Hardware documentation DOC) 92 20 30 10 88 20 30 72 240 20 30 10 40 36 15 25 213 15 25 H12 H13 H14 Prototypes (PO) H15 21 40 Test prototypesU Order circuit boards PDI Preproduction models PD Operating system OP U Kermel specifications OS) H16 H17 30 25 30 30 25 30 100 330 20 70 40 20 240 100 50 60 30 200 20 20 100 20 40 125 10 50 20 15 30 100 431 15 97 60 OP 10 150 20 196 15 -45 195 20 45 25 20 130 30 45 55 46 26 45 31 -21 Drivers OP 121 OP 122 VO dvers DEV OP 13 OP 12 10 30 25 75 20 30 25 Disk drivers (DEV 15 -6 -30 -20 Code software OP 131 Code softwre (C OP 132 Document softwe DOC) OP 133 Code interfaces (C) OP 134 Beta test software (. Utlities U11 105 40 25 40 336 200 42 96 29 274 -10 15 -15 148 15 87 108 21 40 UtO 15 35 150 20 40 753 Utilites specifications (DS) Routine utilities DEV) 20 20 30 17 20 20 60 -15 U12 U13 Complex uities (DEV Uttes documentation DOC 30 -9 90 -10 U14 Beta test uies (T) -11 U15 System integration Architecture decisions OS 49 60 46 6. S10 75 20 12 30 $11 30 45 -15 25 $12 Integration hard'soft (DEV System hard'software test () Project documentation (DOC Integration acceptance testing0 -2 S13 $14 $415 12 10 Appendis Salui Seleed Eni 613 Teme . Total direct costs 2260 CPA:DH 3X Activites changed H. 2X 2X Time: 12 Total direct costs: 2460 CP-AD:DH A 3X 3X Activities changed C. H. 3. 2X 2X Direct Cost Indirect Cost Total Cost Duration 1,500 1,450 1,400 1,350 1,300 1,250 3,500 3,490 3,500 3,560 3,660 3,860 17 2,000 2,040 2.100 2,160 2,260 2,460 16 15 14 13 12 The optimum time-cost schedule would be 16 weeks at a cost of $3,490. Chapter 13 8. (S000) Status Report: Ending Period 1 % Complete AC PV CV SV Task EV 25% 25 50 50 -25 -25 Cumulative Totals 25 50 50 -25 -25 (S000) SV Status Report: Ending Period 2 CV Task % Complete EV AC PV 50% 50 100 100 -50 -50 Cumulative Totals 50 100 100 -50 -50 Append Selaions to Selected Esenies 613 3X Time Total direct costs 2240 3X 2. AB-FG Activties changet C. 3. 2X 2X Time 12 3X Total drect costs 240 CP ADH 3X 3X Activites changed C. 2X 2X Duration Direct Cost Indirect Cost Total Cost 3,500 2,000 2.040 2.100 1,500 1,450 1,400 1,350 17 3,490 16 15 3.500 2,160 2,260 2.460 3.560 1,660 14 13 1300 1,250 3.60 12 The optimum time-cost schedule would be 16 weeks a cost of $3.490. Chapter 13 8. Status Report: Ending Perlod 1 (S000) sComplete EV AC PV CV SV Task -25 -25 25% 25 50 50 -25 Cumulative Totals 25 50 50 -25 (S000) Status Report: Ending Perlod 2 Task EV PV CV SV Complete AC -50 -50 -50 S0% 50 100 100 Cumutative Totals 50 100 100 -50 614 Appendia 1 Soltions Selected Esercises ($000) Status Report: Ending Perlod 3 CV PV SV AC EV Task sComplete -100 200 100 100 -100 -150 100% 100 150 A. 350 -100 -250 100 200 Cumulative Totals (S00) Status Report: Ending Period 4 PV CV SV EV AC Task SComplete 100 -100 200 100 100% 100 150 300 550 50 25 150 60% 50% -75 225 475 200 500 -25 -75 Cumulative Totals (S000) Status Report: Ending Perlod 5 EV AC PV CV SV Task SComplete -100 50 100% 100 200 100 200 250 100% 100% 250 450 800 400 450 50 800 800 Cumulative Totals Status Report: Ending Period 6 (S000) Task SComplete EV AC PV CV SV 100% 100 200 100 -100 250 450 100 50 50 50 50 100% 250 200 100% 450 400 100 75% 150 50 Cumulative Totals 950 900 900 50 Status Report: Ending Period 7 (S000) Task S Complete EV AC PV CV SV 100% 100% 100 250 450 200 60 15 1075 200 100 -100 200 400 150 100 50 1100 250 50 50 100% 450 D. 100% 200 50 20% -40 -35 5% Cumulative Totals 15 1000 -25 75 20000 200O 78008 Appendix 1 Solutions to Selected Exercises 615 Status Report: Ending Period 8 (S000) Task % Complete CV SV EV AC PV 100% 100% 100% 100% -100 50 50 50 -50 -70 100 200 200 400 150 350 100 100 250 250 450 200 450 200 E 100% 300 100 -70 30 10% 30 1330 100 1300 rolec Cumulative Totals 1400 -70 Performance Indexes Summary Period EV AC PV SPI CPI PCIB 25 50 50 .50 .50 2% 50 100 100 .50 .50 3% .50 .95 100 200 350 29 5% 3 475 500 550 86 24% 40% 1.00 1.06 800 800 800 1.00 1.06 48% 900 1000 950 900 1.08 .98 54% 1075 1100 1330 1400 1300 1.02 .95 67% 8. (BAC - EV) (EVIAC) (2,000- 1,300) (1,330/1.400) + AC = + 1,400 = 2,105 EAC, = VAC, = BAC - EAC, = 2,000 – 2,105 = -105 %3D With two-thirds of the project completed the forecast is that the project will be $105,000 over budget at completion. 679 504 Chapter 3 Progress and Performance Mearement and Elion Case 13.3 Scanner Project You have been serving as Electroscan's project manager and are now well along the project. Develop a narrative status renort for the boand of directors of the cham store that discusses the status of the proiect to date (see Table C13.3) and at Con pletion. Be as specific as you can using numbers given and those you might develop. Remember, your audience is not familiar with the jargon used by project managers and computer software personnel; therefore, some explanation may be necessary. Your report will be evaluated on your detailed use of the data, your total perspec tive of the current status and future status of the project, and your recommended changes (if any). TABLE C13.3 Electroscan, Inc 555 Acom Street Sute5 Boston, Massachusetts 29 in store Scanner Propet thousands of dolars) Actual Progressas of Janury Name PV EV AC SV CV BAC EAC Scanner projest 420 295 476 -25 915 1103 H10 Hardware Hardware spectications (DS) Hardware design DS Hardware documentation DOC) 92 20 30 10 88 20 30 72 240 20 30 10 40 36 15 25 213 15 25 H12 H13 H14 Prototypes (PO) H15 21 40 Test prototypesU Order circuit boards PDI Preproduction models PD Operating system OP U Kermel specifications OS) H16 H17 30 25 30 30 25 30 100 330 20 70 40 20 240 100 50 60 30 200 20 20 100 20 40 125 10 50 20 15 30 100 431 15 97 60 OP 10 150 20 196 15 -45 195 20 45 25 20 130 30 45 55 46 26 45 31 -21 Drivers OP 121 OP 122 VO dvers DEV OP 13 OP 12 10 30 25 75 20 30 25 Disk drivers (DEV 15 -6 -30 -20 Code software OP 131 Code softwre (C OP 132 Document softwe DOC) OP 133 Code interfaces (C) OP 134 Beta test software (. Utlities U11 105 40 25 40 336 200 42 96 29 274 -10 15 -15 148 15 87 108 21 40 UtO 15 35 150 20 40 753 Utilites specifications (DS) Routine utilities DEV) 20 20 30 17 20 20 60 -15 U12 U13 Complex uities (DEV Uttes documentation DOC 30 -9 90 -10 U14 Beta test uies (T) -11 U15 System integration Architecture decisions OS 49 60 46 6. S10 75 20 12 30 $11 30 45 -15 25 $12 Integration hard'soft (DEV System hard'software test () Project documentation (DOC Integration acceptance testing0 -2 S13 $14 $415 12 10 Appendis Salui Seleed Eni 613 Teme . Total direct costs 2260 CPA:DH 3X Activites changed H. 2X 2X Time: 12 Total direct costs: 2460 CP-AD:DH A 3X 3X Activities changed C. H. 3. 2X 2X Direct Cost Indirect Cost Total Cost Duration 1,500 1,450 1,400 1,350 1,300 1,250 3,500 3,490 3,500 3,560 3,660 3,860 17 2,000 2,040 2.100 2,160 2,260 2,460 16 15 14 13 12 The optimum time-cost schedule would be 16 weeks at a cost of $3,490. Chapter 13 8. (S000) Status Report: Ending Period 1 % Complete AC PV CV SV Task EV 25% 25 50 50 -25 -25 Cumulative Totals 25 50 50 -25 -25 (S000) SV Status Report: Ending Period 2 CV Task % Complete EV AC PV 50% 50 100 100 -50 -50 Cumulative Totals 50 100 100 -50 -50 Append Selaions to Selected Esenies 613 3X Time Total direct costs 2240 3X 2. AB-FG Activties changet C. 3. 2X 2X Time 12 3X Total drect costs 240 CP ADH 3X 3X Activites changed C. 2X 2X Duration Direct Cost Indirect Cost Total Cost 3,500 2,000 2.040 2.100 1,500 1,450 1,400 1,350 17 3,490 16 15 3.500 2,160 2,260 2.460 3.560 1,660 14 13 1300 1,250 3.60 12 The optimum time-cost schedule would be 16 weeks a cost of $3.490. Chapter 13 8. Status Report: Ending Perlod 1 (S000) sComplete EV AC PV CV SV Task -25 -25 25% 25 50 50 -25 Cumulative Totals 25 50 50 -25 (S000) Status Report: Ending Perlod 2 Task EV PV CV SV Complete AC -50 -50 -50 S0% 50 100 100 Cumutative Totals 50 100 100 -50 614 Appendia 1 Soltions Selected Esercises ($000) Status Report: Ending Perlod 3 CV PV SV AC EV Task sComplete -100 200 100 100 -100 -150 100% 100 150 A. 350 -100 -250 100 200 Cumulative Totals (S00) Status Report: Ending Period 4 PV CV SV EV AC Task SComplete 100 -100 200 100 100% 100 150 300 550 50 25 150 60% 50% -75 225 475 200 500 -25 -75 Cumulative Totals (S000) Status Report: Ending Perlod 5 EV AC PV CV SV Task SComplete -100 50 100% 100 200 100 200 250 100% 100% 250 450 800 400 450 50 800 800 Cumulative Totals Status Report: Ending Period 6 (S000) Task SComplete EV AC PV CV SV 100% 100 200 100 -100 250 450 100 50 50 50 50 100% 250 200 100% 450 400 100 75% 150 50 Cumulative Totals 950 900 900 50 Status Report: Ending Period 7 (S000) Task S Complete EV AC PV CV SV 100% 100% 100 250 450 200 60 15 1075 200 100 -100 200 400 150 100 50 1100 250 50 50 100% 450 D. 100% 200 50 20% -40 -35 5% Cumulative Totals 15 1000 -25 75 20000 200O 78008 Appendix 1 Solutions to Selected Exercises 615 Status Report: Ending Period 8 (S000) Task % Complete CV SV EV AC PV 100% 100% 100% 100% -100 50 50 50 -50 -70 100 200 200 400 150 350 100 100 250 250 450 200 450 200 E 100% 300 100 -70 30 10% 30 1330 100 1300 rolec Cumulative Totals 1400 -70 Performance Indexes Summary Period EV AC PV SPI CPI PCIB 25 50 50 .50 .50 2% 50 100 100 .50 .50 3% .50 .95 100 200 350 29 5% 3 475 500 550 86 24% 40% 1.00 1.06 800 800 800 1.00 1.06 48% 900 1000 950 900 1.08 .98 54% 1075 1100 1330 1400 1300 1.02 .95 67% 8. (BAC - EV) (EVIAC) (2,000- 1,300) (1,330/1.400) + AC = + 1,400 = 2,105 EAC, = VAC, = BAC - EAC, = 2,000 – 2,105 = -105 %3D With two-thirds of the project completed the forecast is that the project will be $105,000 over budget at completion. 679
Expert Answer:
Answer rating: 100% (QA)
The current status of the Scanner project is that at present the planned value of the project was 42... View the full answer

Related Book For 

Project management the managerial process
ISBN: 978-0073403342
5th edition
Authors: Eric W Larson, Clifford F. Gray
Posted Date:
Students also viewed these accounting questions
-
You have been serving as Electroscans project manager and are now well along in the project. Develop a narrative status report for the board of directors of the chain store that discusses the status...
-
As a class project you have been asked to project the proportion of time a professor spends on various activities. You have decided to use the work-sampling method. Your initial observations are...
-
PROBLEM: Pamana Company's bookkeeper is not familiar with accrual accounting concepts. He determined net income for 2022 to be P 79,800. In your audit of the company you determine the following: 1....
-
Micah Bartlett Company purchased equipment on January 1, 2013, at a total invoice cost of $400,000. The equipment has an estimated salvage value of $10,000 and an estimated useful life of 5 years....
-
Use the demand function and the supply function for the avocado market to determine how the equilibrium price and quantity change when a 55¢ per lb specific tax is imposed on this market, as...
-
Some Americans fear that as countries such as China and India become more productive in industries such as computers and computer programming, once dominated by the United States, the wages of...
-
For checking the thermodynamic consistency of VLE data (a) A test is usually performed on the basis of the Gibbs-Duhem equation in terms of the activity coefficients (b) The data can be obtained from...
-
Hunter, Folgers, and Tulip have been partners while sharing net income and loss in a 5:3:2 ratio. On January 31, the date Tulip retires from the partnership, the equities of the partners are Hunter,...
-
Help make business rules for ERD Diagram. Example: 1. Each CONCESSIONAIRE can be assigned to operate to at least one PARK 2. Each PARK is assigned to one and only one CONCESSIONAIRE ERD - The City...
-
Euro Corporation, a U.S. corporation, operates through a branch in Germany. During 2022, the branch reported taxable income of $1,000,000 and paid German income taxes of $300,000. In addition, Euro...
-
what is OLAP Operations.
-
Outline the principal responsibilities of audit committees and explain briefly how audit committees may help strengthen auditors' independence.
-
Eight part-time workers at an airline catering facility prepared 2,010 meals in 6 hours. What is the labor productivity of the part-time workers at this facility?
-
Is a highly standardized product usually produced through a make-to-order or a make-to-stock processing strategy?
-
Five Customs and Immigration officers worked 7 hours each to check visas and stamp the passports of 673 arriving visitors at an airport terminal. What is the labor productivity of this group of five...
-
Omaha Steaks is a food retailing company that specializes in mail order delivery of beef. The company is headquartered in Omaha Nebraska and was founded as a butcher shop in 1917. Omaha Steaks wants...
-
Compute the net pay for each employee and answer the additional requirements that follow: Employee Ericka Bilango Alani Ching Audrey Tan Basic Pay 40,300.00 37,600.00 35,500.00 SSS 581.30 581.30...
-
Gordon and Lisa estimate that they will need $1,875,000 in 40 years for their retirement years. If they can earn 8 percent annually on their funds, how much do they need to save annually?
-
What differences would you expect to see between the kinds of influence currencies that a project manager in a functional matrix would use and the influence a project manager of a dedicated project...
-
In month 9 the following project information is available: actual cost is $2,000, earned value is $2,100, and planned cost is $2,400. Compute the SV and CV for the project.
-
What can a project manager do to avoid some of the pitfalls of a highly cohesive project team?
-
What is the value of the finite population correction factor in the formula for \(\sigma_{\bar{X}}^{2}\) when (a) \(n=8\) and \(N=640\) ? (b) \(n=100\) and \(N=8,000\) ? (c) \(n=250\) and...
-
The following is the time taken (in hours) for the delivery of 8 parcels within a city: 28,32,20,26, 42,40,28, and 30 . Use these figures to judge the reasonableness of delivery services when they...
-
Prove that \(\mu_{\bar{X}}=\mu\) for random samples from discrete (finite or countably infinite) populations.

Study smarter with the SolutionInn App