

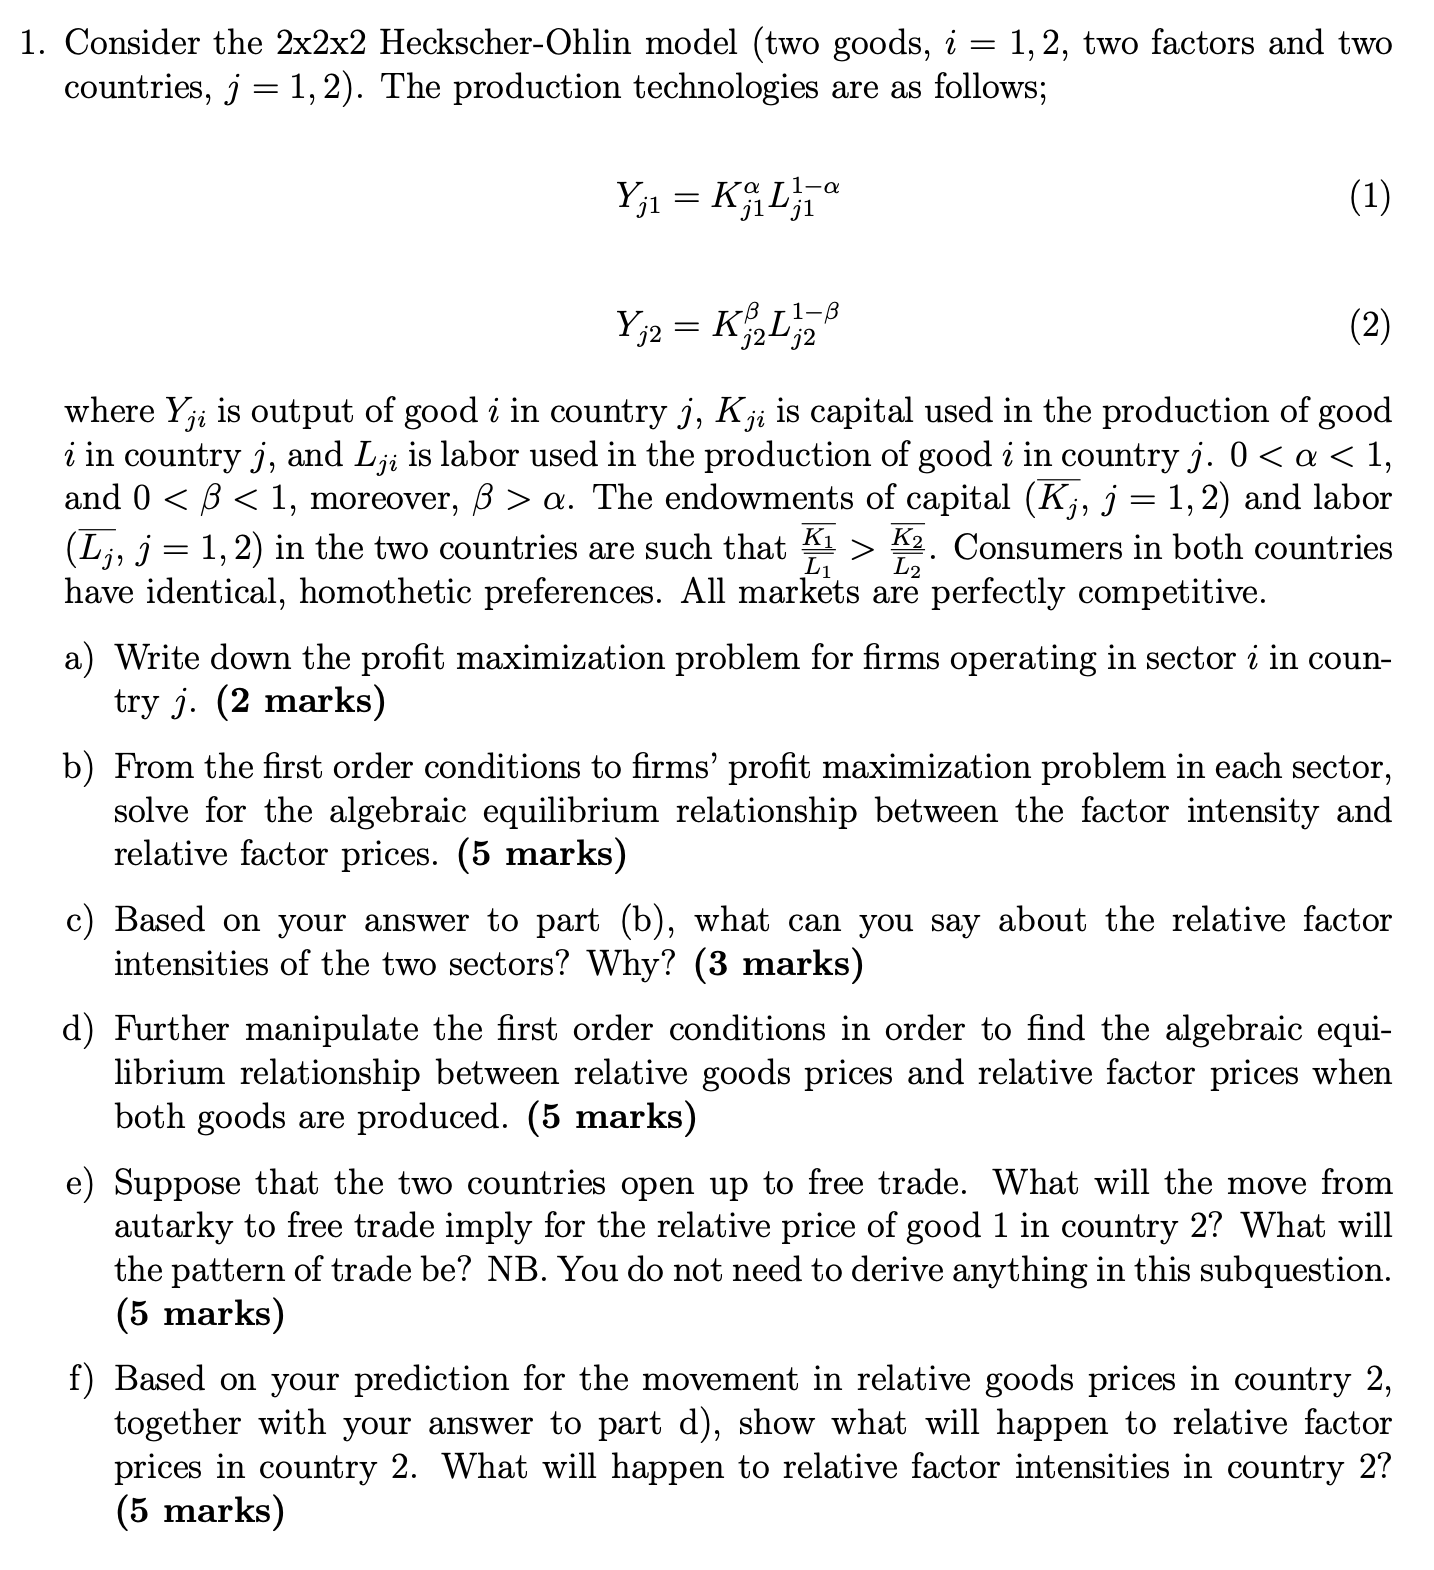
== 1. Consider the 2x2x2 Heckscher-Ohlin model (two goods, i countries, j 1,2). The production technologies...
Fantastic news! We've Found the answer you've been seeking!
Question:
Expert Answer:
a Write down the profit maximization problem for firms operating in sector i in coun try j 2 marks i... View the full answer

Related Book For 

Income Tax Fundamentals 2013
ISBN: 9781285586618
31st Edition
Authors: Gerald E. Whittenburg, Martha Altus Buller, Steven L Gill
Posted Date:
