

1. Draw a process flow diagram showing the major process steps, inventories, and flows.Indicate the capacity at...
Question:
1. Draw a process flow diagram showing the major process steps, inventories, and flows.Indicate the capacity at each of the process steps. You should assume:
a. 16,000 barrels per day is the average of deliveries over the 20 days from 9/20--‐10/9
b. Each truck carries 75 barrels on average
c. Trucks arrive uniformly over a 12--‐hour period
d. Trucks carry 70% wet berries and 30% dry berries
e. The plant follows “last year’s schedule,” which is described as, “Trucks arrived starting at 7:00 a.m., and we only staffed the dumpers and the bins, and then started the rest of the operation at 11:00 a.m.”
2. Which resource (or resources) is the bottleneck? That is, what is the resource (or resources) that is limiting the rate at which the plant can process berries, given the current product mix of dry and wet berries?
3. How late does the plant need to be open (i.e., when does the plant shut down) during this peak season?
4. How bad is the truck delay at the loading dock during this peak season?
5. What are the basic options for improving the operation? Which options would you recommend and why?
HINT: We will assume that the process for wet berries operates at the pace given by the bottleneck in all process steps (think of each resource as a unit built over a conveyor belt)
Receiving Plant No. 1 (RP1)
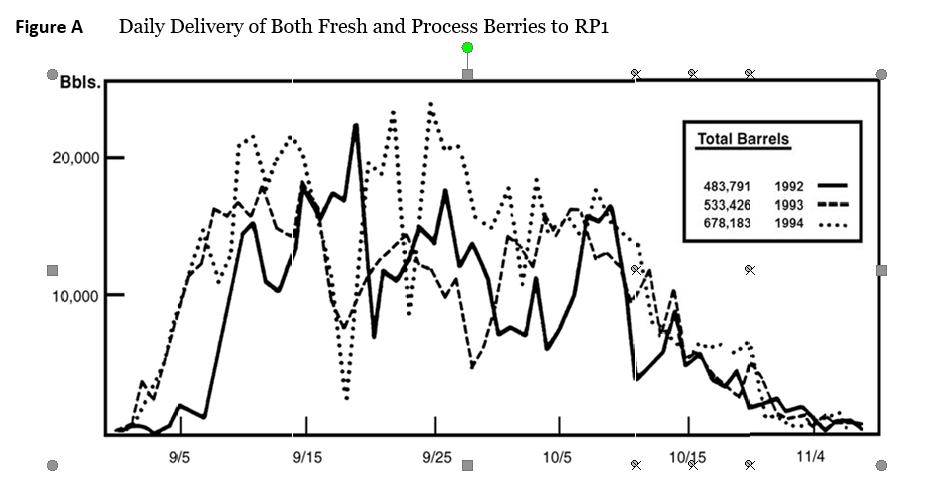
RP1 received both “fresh” fruit and “process” fruit during a season that usually started early in September and was effectively finished by early December (see Figure A). The fresh fruit operation (preparing cranberries for sale as whole fresh fruit) was completely separate from the process fruit operation (that prepares cranberries for juice, canning, freezing, and other process fruit products) and took the fruit from receiving through packaging. This case is concerned only with the process fruit operation.
The handling of process fruit at RP1 was highly mechanized. The process could be classified into several operations: receiving and testing, dumping, temporary holding, destoning,2 dechaffing,3 drying, separation, and bulking and bagging. The objective of the total process was to gather bulk berries and prepare them for storage and processing into frozen fresh berries, sauce, and juice.
Process Fruit Receiving
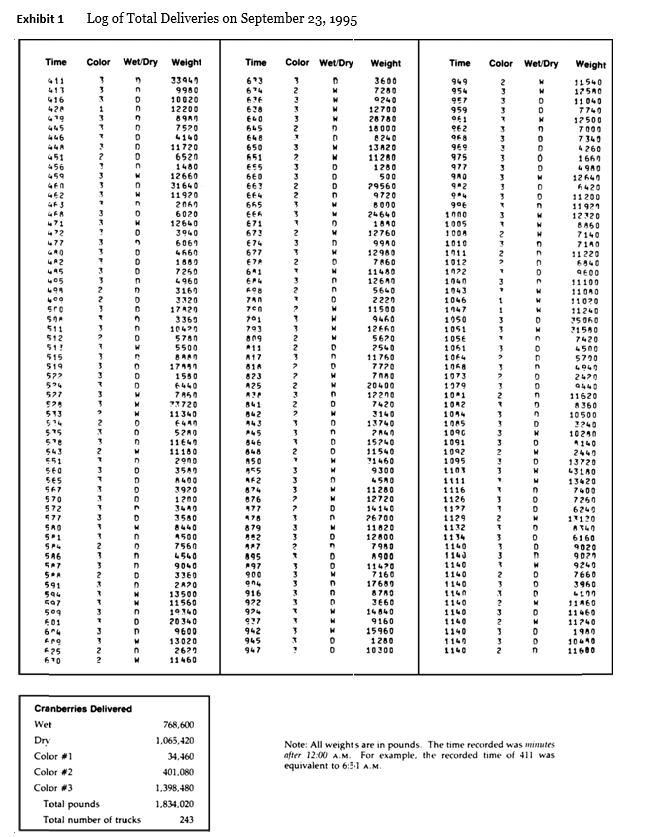
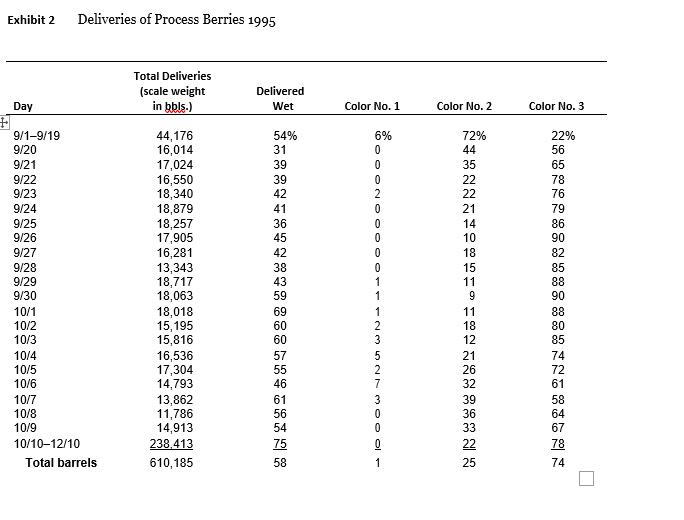
Bulk trucks carrying process berries arrived at RP1 randomly throughout the day as shown in Exhibit 1. The average truck delivery was 75 bbls. When the trucks arrived at RP1 they were weighed, and the gross weight and the tare (empty) weight were recorded. Prior to unloading, a sample of about 30 lbs. of fruit (0.3 bbl.) was taken from the truck. Later, this sample would be run through a small version of the cleaning and drying process used in the plant. By comparing the before and after weight of this sample, it was possible to estimate the percentage of the truck’s net weight made up of clean, dry berries. At the same time, another sample was taken to determine the percentage of unusable berries (poor, smaller, and frosted berries) in the truck. The grower was credited for the estimated weight of the clean, dry, usable berries. (See Exhibit 2 for total 1995 deliveries of process berries.)
At the time the truck was weighed, the truckload of berries was graded according to color. Using color pictures as a guide, the chief berry receiver classified the berries as Nos. 1, 2A, 2B, or 3, from poorest color (No. 1) to best (No. 3). There was a premium of $1.50 per bbl. paid for No. 3 berries, since color was considered to be a very important attribute of both juice products and whole sauce. Whenever there was any question about whether or not a truckload was No. 2B or No. 3 berries, the chief berry receiver usually chose No. 3. In 1995 the $1.50 premium was paid on about 450,000 bbls. of berries. When these berries were used, however, it was found that only about half of them were No. 3’s.
To improve this yield, Schaeffer was considering the installation of a light meter system for color grading. This system was projected to cost $40,000 and would require a full-time skilled operator at the same pay grade as the chief berry receiver.
Temporary Holding
After a truckload of process berries had been weighed, sampled, and color graded, the truck moved to one of the five Kiwanee dumpers. The truck was backed onto the dumper platform which then tilted until the contents of the truck dumped onto one of five rapidly moving belt conveyors. Each of the five conveyors took the berries to the second level of the plant and deposited them on other conveyors capable of running the berries into any one of 27 temporary holding bins. Bins numbered 1-24 held 250 bbls. of berries each. Bins 25, 26, and 27 held 400 bbls. each. All of the conveyors were controlled from a central control panel.
It usually took from 7 to 8 minutes to back a truck onto a Kiwanee dumper, empty its contents, and leave the platform. At times some trucks had to wait several hours, however, before they could empty their contents. These waits occurred when the holding bins became full and there was no place in the receiving plant to temporarily store berries before further operations.
The holding bins emptied onto conveyors on the first level of the plant. Once the bins were opened, the berries flowed onto the conveyors and started their way through the destoning (dry berries only), dechaffing, drying (water-harvested berries only), quality grading, and either bulk loading or bagging operations.
Destoning, Dechaffing, and Drying
Holding bins 25-27 were for wet (water-harvested) berries only. Holding bins 17-24 could be used for either wet or dry berries. Wet berries from these bins were taken directly to one of the three dechaffing units (destoning was unnecessary with water-harvested berries) which could process up to 1,500 bbls. per hour each. After dechaffing, these wet berries were taken to one of the three drying units where they were dried at rates up to 200 bbls. per hour per dryer.
Holding bins 1-16 were for dry berries only. Berries from these bins were routed through one of three destoning units, each of which could process up to 1,500 bbls. of berries per hour, before going through a dechaffing unit. Frequently, both wet and dry berries were processed at the same time though the system. The wet berries would be processed through the part of the system that included the dryers, while the dry berries were processed through the area containing the destoning units. National Cranberry’s current plant layout had two dechaffing units dedicated to wet berries, and one to dry berries.
Superintendent Walliston had told O’Brien that, with an increasing percentage of wet berries coming to the plant, it might make sense to convert some of holding bins 1-16 so they could be used for wet berries also. This would cost $10,000 per bin. Or, perhaps, he had mentioned, a few new dryers might be needed. These would cost $60,000 each. He wondered what the benefits might be of adding more dryers and whether those benefits would warrant the cost.
Quality Grading
After destoning, dechaffing, and drying, berries were transported to large take-away conveyors that moved berries from the first level of the receiving building to the third level of the adjoining separator building. Here these take away conveyors became “feed conveyors” as they were now feeding berries into the jumbo separators (see Figure B). The jumbo separators identified three classes of berries—first quality berries, potential second-quality berries, and unacceptable berries.
The separation process was a simple one that was based on the fact that good cranberries will bounce higher than poor cranberries (see Figure C for a drawing of the separation process). The first-quality berries went directly onto one of three take-away conveyors on the second level and were transported to the shipping area. The unacceptable berries fell through waste chutes into water-filled waste flumes on the first level and were floated off to the disposal area. The potential second-quality berries fell into the Bailey mills on the second level of the building. The Bailey mills separated the stream of incoming berries into second-quality berries and unacceptable berries. The Bailey mills operated on the same principle as the jumbo separators. Over the years the percentage of second-quality berries had consistently been close to 12%. Each of the three separator lines could process up to 450 bbls. per hour, but the rate of processing declined as the percentage of bad fruit increased. It was estimated that the average effective capacity was probably close to 400 bbls. per hour for each line.
Bulking and Bagging
Conveyors carried berries from the separator building into the shipping building, feeding berries onto any one of the three main flexible conveyors in the shipping area. Each of the three conveyors in the shipping area could be moved to feed berries into bagging stations, bulk bin stations, or bulk truck stations. The berries left RP1 in bulk trucks for shipment directly to the finish processing plant or in bins for storage at freezers with bulk storage capability.
Scheduling the Work Force
During the harvest season—September 1 to December 15—the process fruit side of RP1 was operated seven days a week with either a 27-member work force or a 53-member work force, depending on the relative volume of berry receipts. Will Walliston explained to Mel O’Brien,
Last year, trucks arrived at 7:00, and we only staffed the dumpers and the bins, and then started the rest of the operation at 11:00. This year, with an increase in the percentage of wet berries that we expect, we’re going to have to fire up the operation, on peak days, with two shifts – one from 7:00 to 3:00, and one from 3:00 to 11:00. I’m hoping that’ll cut into last year’s huge overtime expenditures and will limit the extra capital that we’ll need to spend. But, that’s what your report will help me decide.
There were 27 employees at RP1 who were employed for the entire year; all others were hired for the season only. The 27 non-seasonal employees were all members of the Teamsters Union, as were 15 seasonal workers. Seasonal workers could work only between the dates of August 15 and December 25 by agreement with the union. Most seasonal workers were employed via a state employment agency that set up operations each fall. The employment agency helped in placing seasonal workers in the receiving plant and in harvesting jobs with the local growers. The pay rate for seasonal workers in the process fruit section was $8.00 per hour. They were paid the overtime rate of 1-1/2 times their straight-time rate for anything over 40 hours per week. The straight-time pay rate for the full-year employees averaged $13.00 per hour.
When it was necessary to work beyond 11 p.m., a crew of only eight or nine workers was required to run the holding bins empty and do bulk loading. Although dry fruit could be held in the bins overnight, it was considered undesirable to hold wet fruit any longer than necessary, so wet fruit was always run out before shutting down. The plant never ran more than 22 hours a day, since at least 2 hours were required for cleaning and maintenance work. (Downtime due to unscheduled maintenance was very small; said Walliston: “We ran 350,000 bbls. through the wet system in 1995 and we were down a total of less than 8 hours.”)
Expert Answer:
Fresh and Processed Berries Daily Delivery 20000 Bbls Total Barrels 483791 in 1992 533426 in 1993 67... View the full answer


Operations and Supply Chain Management
ISBN: 978-0078024023
14th edition
Authors: F. Robert Jacobs, Richard Chase
