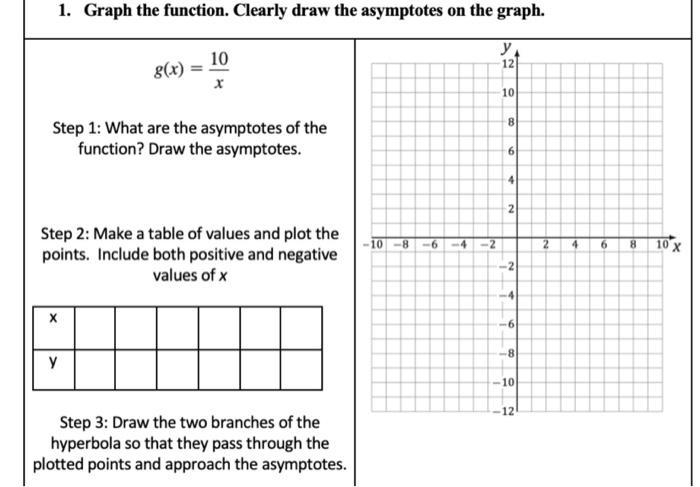
1. Graph the function. Clearly draw the asymptotes on the graph. y 12 g(x) 10 x...
Fantastic news! We've Found the answer you've been seeking!
Question:
Transcribed Image Text:
1. Graph the function. Clearly draw the asymptotes on the graph. y₁ 12 g(x) 10 x Step 1: What are the asymptotes of the function? Draw the asymptotes. y Step 2: Make a table of values and plot the points. Include both positive and negative values of x Step 3: Draw the two branches of the hyperbola so that they pass through the plotted points and approach the asymptotes. 10-8 -6 -4 -2 10 8 6 4 2 -2 -4 -6 -8 10 12 2 4 6 8 10 X 2. Graph the function. Clearly draw the asymptotes on the graph. State the domain and range. g(x) Step 1: What are the asymptotes? Draw the asymptotes. Step 2: Plot points to the left of the vertical asymptote, x values less than the x asymptote. Step 3: Plot points to the right of the vertical asymptote, x values more than the x asymptote. Step 4: Draw the two branches of the hyperbola so that they pass through the plotted points and approach the asymptotes. Step 5: Domain and range. 10 -8 -6 -4 -2 12 10 8 6 4 2 -2 -4 -6 -8 -10 12 2 4 6 8 10 X 1. Graph the function. Clearly draw the asymptotes on the graph. y₁ 12 g(x) 10 x Step 1: What are the asymptotes of the function? Draw the asymptotes. y Step 2: Make a table of values and plot the points. Include both positive and negative values of x Step 3: Draw the two branches of the hyperbola so that they pass through the plotted points and approach the asymptotes. 10-8 -6 -4 -2 10 8 6 4 2 -2 -4 -6 -8 10 12 2 4 6 8 10 X 2. Graph the function. Clearly draw the asymptotes on the graph. State the domain and range. g(x) Step 1: What are the asymptotes? Draw the asymptotes. Step 2: Plot points to the left of the vertical asymptote, x values less than the x asymptote. Step 3: Plot points to the right of the vertical asymptote, x values more than the x asymptote. Step 4: Draw the two branches of the hyperbola so that they pass through the plotted points and approach the asymptotes. Step 5: Domain and range. 10 -8 -6 -4 -2 12 10 8 6 4 2 -2 -4 -6 -8 -10 12 2 4 6 8 10 X
Expert Answer:
Answer rating: 100% (QA)
1 the function gx 10x has the following asymptotes The above plot sho... View the full answer
Related Book For
Basic Technical Mathematics
ISBN: 9780137529896
12th Edition
Authors: Allyn J. Washington, Richard Evans
Posted Date:
Students also viewed these mathematics questions
-
In Exercises sketch the graph of a function having the given characteristics. f(0) = f(6) = 0 f'(3) = f'(5) = 0 f'(x) > 0 for x < 3 f'(x) > 0 for 3 < x < 5 f'(x) < 0 for x > 5 f"(x) < 0 for x < 3 or...
-
(a) By reading values from the given graph of f, use four rectangles to find a lower estimate and an upper estimate for the area under the given graph of f from x = 0 to x = 8. In each case sketch...
-
Consider three mutually exclusive alternatives. The MARR is 10%. (a) For Alt. X, compute the benefit-cost ratio. (b) Based on the payback period, which alternative should be selected? (c) Determine...
-
Let (x, y) = x 4 2x 2 + y 2 6y. (a) Find the critical points of and use the Second Derivative Test to determine whether they are a local minima or a local maxima. (b) Find the minimum value of ...
-
How many IRRs are there in part (b) of Problem 9? Does the IRR rule work in this case?
-
Consider Example 17.4, in which methanol is produced in a PFR. After being cooled, the reactor effluent is now sent to a flash vessel, V-1103, as shown in Figure P17.9. The overhead gas stream from...
-
Write a code to test a Gaussian pseudorandom number generator. If you do not have a canned generator available, write a generator based on the Box-Muller algorithm in Appendix I. Apply the following...
-
The following information is available for the preparation of the government-wide financial statements for the City of Southern Springs as of April 30, 2012: Cash and cash equivalents, governmental...
-
19. Derive the augmented Harrod-Domar equation: s/0 = g*+n+8. 20. What is demographic transition? Why is it relevant for the Harrod-Domar model?
-
Suppose an investment project costs $100,000 to start in period 0, and we know of the dividends it will return with certainty. The project returns dividends of $0 in period 0, $20,000 in period 1,...
-
What is the force in pounds exerted upwards on a piston with a diameter of 4 inches if a guage indicates the internal pressure in the cylinder is 1000 psi?
-
Mapleton Family Medicine is a physician group practice located in a small city (population 150,000) in the Midwest. Mapleton is an eight-physician practice, consisting of family physicians,...
-
Why are there are no such consequences to patients who demand doctors, nurses, or workers of a specific race to administer their healthcare?
-
What are some of the behaviors that may indicate to managers that organizing activities are occurring?
-
Describe the three phases of the labor relations process. Why are all phases equally important?
-
How did the Social Security Act change the way retirement benefits were viewed?
-
In Java: Fun with Points, Lines, and Composition Define a Point class (Point.java). Your Point class will have thefollowing members (and no others) variables to hold the x and y values and accessor...
-
As long as we can't lose any money, we have a risk-free investment." Discuss this comment. Q2: Both investing and gambling can be defined as "undertaking risk in order to earn a profit." Explain how...
-
Solve the given systems of equations by the method of elimination by substitution. 33x + 2y = 34 40y = 9x + 11
-
Solve the given inequalities on a calculator such that the display is the graph of the solution. 8- R 2R+1 0
-
Express each radical in simplest form, rationalize denominators, and perform the indicated operations. 375R+ 248R - 218R
-
Why is the effect of a lockdown different from that of an oil shock? There is an important difference between a lockdown and an oil shock. Although a lockdown is typically temporary, not all firms...
-
Why might the 'Goggle mobility index' not be a good measure} of the fall in economic activity during a lockdown? Whether it provides, or not, a good measure of economic activity, depends on the...
-
Fill in the values in the table below for inflation and expected inflation using the 1960s. The data will come from FRED as they did in the last question. You will have the most success using a...
Study smarter with the SolutionInn App