

1. In the Microsoft Excel document included with your exam materials you will find a spreadsheet...
Fantastic news! We've Found the answer you've been seeking!
Question:
Transcribed Image Text:
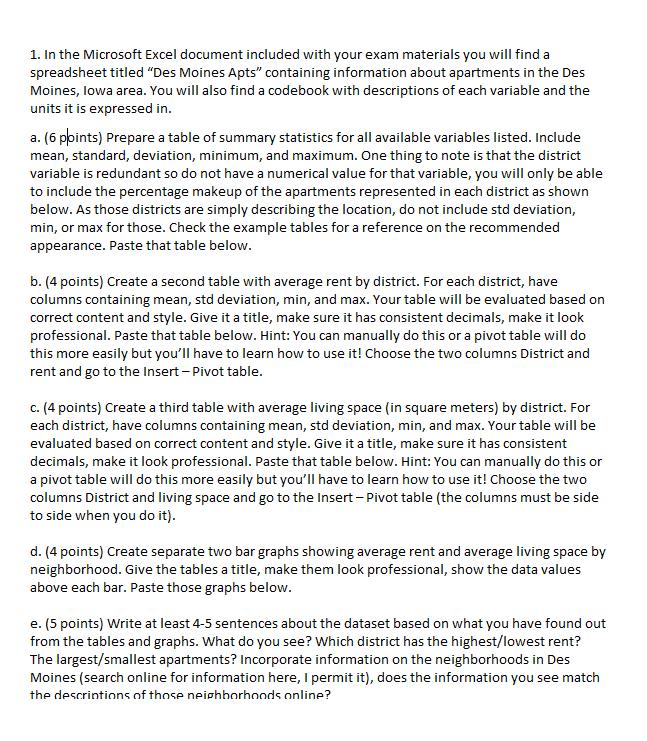
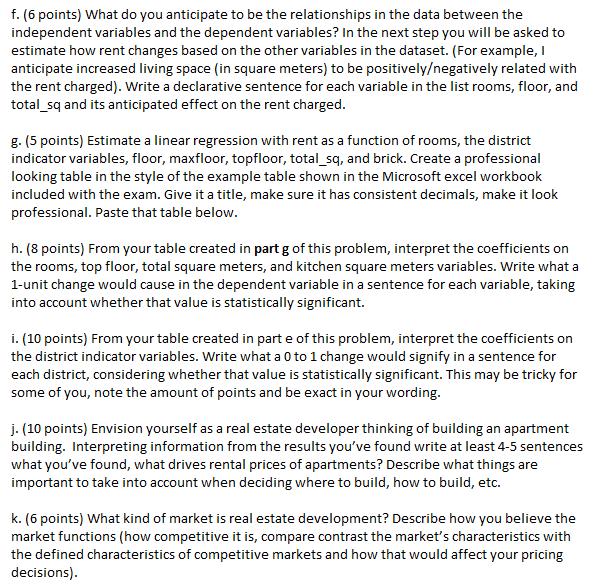
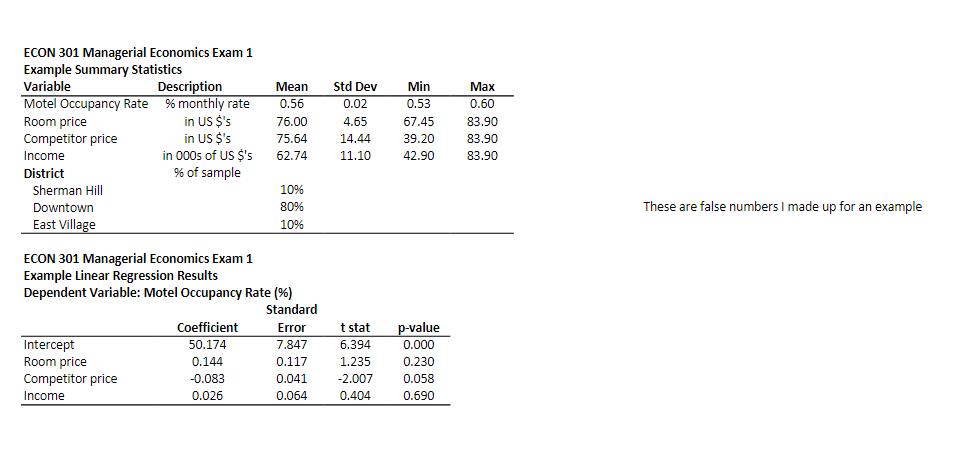
1. In the Microsoft Excel document included with your exam materials you will find a spreadsheet titled "Des Moines Apts" containing information about apartments in the Des Moines, Iowa area. You will also find a codebook with descriptions of each variable and the units it is expressed in. a. (6 points) Prepare a table of summary statistics for all available variables listed. Include mean, standard, deviation, minimum, and maximum. One thing to note is that the district variable is redundant so do not have a numerical value for that variable, you will only be able to include the percentage makeup of the apartments represented in each district as shown below. As those districts are simply describing the location, do not include std deviation, min, or max for those. Check the example tables for a reference on the recommended appearance. Paste that table below. b. (4 points) Create a second table with average rent by district. For each district, have columns containing mean, std deviation, min, and max. Your table will be evaluated based on correct content and style. Give it a title, make sure it has consistent decimals, make it look professional. Paste that table below. Hint: You can manually do this or a pivot table will do this more easily but you'll have to learn how to use it! Choose the two columns District and rent and go to the Insert - Pivot table. c. (4 points) Create a third table with average living space (in square meters) by district. For each district, have columns containing mean, std deviation, min, and max. Your table will be evaluated based on correct content and style. Give it a title, make sure it has consistent decimals, make it look professional. Paste that table below. Hint: You can manually do this or a pivot table will do this more easily but you'll have to learn how to use it! Choose the two columns District and living space and go to the Insert - Pivot table (the columns must be side to side when you do it). d. (4 points) Create separate two bar graphs showing average rent and average living space by neighborhood. Give the tables a title, make them look professional, show the data values above each bar. Paste those graphs below. e. (5 points) Write at least 4-5 sentences about the dataset based on what you have found out from the tables and graphs. What do you see? Which district has the highest/lowest rent? The largest/smallest apartments? Incorporate information on the neighborhoods in Des Moines (search online for information here, I permit it), does the information you see match the descriptions of those neighborhoods online? f. (6 points) What do you anticipate to be the relationships in the data between the independent variables and the dependent variables? In the next step you will be asked to estimate how rent changes based on the other variables in the dataset. (For example, I anticipate increased living space (in square meters) to be positively/negatively related with the rent charged). Write a declarative sentence for each variable in the list rooms, floor, and total_sq and its anticipated effect on the rent charged. g. (5 points) Estimate a linear regression with rent as a function of rooms, the district indicator variables, floor, maxfloor, topfloor, total_sq, and brick. Create a professional looking table in the style of the example table shown in the Microsoft excel workbook included with the exam. Give it a title, make sure it has consistent decimals, make it look professional. Paste that table below. h. (8 points) From your table created in part g of this problem, interpret the coefficients on the rooms, top floor, total square meters, and kitchen square meters variables. Write what a 1-unit change would cause in the dependent variable in a sentence for each variable, taking into account whether that value is statistically significant. i. (10 points) From your table created in part e of this problem, interpret the coefficients on the district indicator variables. Write what a 0 to 1 change would signify in a sentence for each district, considering whether that value is statistically significant. This may be tricky for some of you, note the amount of points and be exact in your wording. j. (10 points) Envision yourself as a real estate developer thinking of building an apartment building. Interpreting information from the results you've found write at least 4-5 sentences what you've found, what drives rental prices of apartments? Describe what things are important to take into account when deciding where to build, how to build, etc. k. (6 points) What kind of market is real estate development? Describe how you believe the market functions (how competitive it is, compare contrast the market's characteristics with the defined characteristics of competitive markets and how that would affect your pricing decisions). ECON 301 Managerial Economics Exam 1 Example Summary Statistics Variable Motel Occupancy Rate Room price Competitor price Income District Sherman Hill Downtown East Village Description % monthly rate in US $'s Intercept Room price Competitor price Income in US $'s in 000s of US $'s % of sample Mean 0.56 76.00 Coefficient 50.174 0.144 -0.083 0.026 75.64 62.74 ECON 301 Managerial Economics Exam 1 Example Linear Regression Results Dependent Variable: Motel Occupancy Rate (%) Standard 10% 80% 10% Std Dev 0.02 4.65 14.44 11.10 Error 7.847 0.117 0.041 -2,007 0.064 0.404 t stat p-value 0.000 0.230 0.058 0.690 Min 0.53 67.45 39.20 42.90 6.394 1.235 Max 0.60 83.90 83.90 83.90 These are false numbers I made up for an example 1. In the Microsoft Excel document included with your exam materials you will find a spreadsheet titled "Des Moines Apts" containing information about apartments in the Des Moines, Iowa area. You will also find a codebook with descriptions of each variable and the units it is expressed in. a. (6 points) Prepare a table of summary statistics for all available variables listed. Include mean, standard, deviation, minimum, and maximum. One thing to note is that the district variable is redundant so do not have a numerical value for that variable, you will only be able to include the percentage makeup of the apartments represented in each district as shown below. As those districts are simply describing the location, do not include std deviation, min, or max for those. Check the example tables for a reference on the recommended appearance. Paste that table below. b. (4 points) Create a second table with average rent by district. For each district, have columns containing mean, std deviation, min, and max. Your table will be evaluated based on correct content and style. Give it a title, make sure it has consistent decimals, make it look professional. Paste that table below. Hint: You can manually do this or a pivot table will do this more easily but you'll have to learn how to use it! Choose the two columns District and rent and go to the Insert - Pivot table. c. (4 points) Create a third table with average living space (in square meters) by district. For each district, have columns containing mean, std deviation, min, and max. Your table will be evaluated based on correct content and style. Give it a title, make sure it has consistent decimals, make it look professional. Paste that table below. Hint: You can manually do this or a pivot table will do this more easily but you'll have to learn how to use it! Choose the two columns District and living space and go to the Insert - Pivot table (the columns must be side to side when you do it). d. (4 points) Create separate two bar graphs showing average rent and average living space by neighborhood. Give the tables a title, make them look professional, show the data values above each bar. Paste those graphs below. e. (5 points) Write at least 4-5 sentences about the dataset based on what you have found out from the tables and graphs. What do you see? Which district has the highest/lowest rent? The largest/smallest apartments? Incorporate information on the neighborhoods in Des Moines (search online for information here, I permit it), does the information you see match the descriptions of those neighborhoods online? f. (6 points) What do you anticipate to be the relationships in the data between the independent variables and the dependent variables? In the next step you will be asked to estimate how rent changes based on the other variables in the dataset. (For example, I anticipate increased living space (in square meters) to be positively/negatively related with the rent charged). Write a declarative sentence for each variable in the list rooms, floor, and total_sq and its anticipated effect on the rent charged. g. (5 points) Estimate a linear regression with rent as a function of rooms, the district indicator variables, floor, maxfloor, topfloor, total_sq, and brick. Create a professional looking table in the style of the example table shown in the Microsoft excel workbook included with the exam. Give it a title, make sure it has consistent decimals, make it look professional. Paste that table below. h. (8 points) From your table created in part g of this problem, interpret the coefficients on the rooms, top floor, total square meters, and kitchen square meters variables. Write what a 1-unit change would cause in the dependent variable in a sentence for each variable, taking into account whether that value is statistically significant. i. (10 points) From your table created in part e of this problem, interpret the coefficients on the district indicator variables. Write what a 0 to 1 change would signify in a sentence for each district, considering whether that value is statistically significant. This may be tricky for some of you, note the amount of points and be exact in your wording. j. (10 points) Envision yourself as a real estate developer thinking of building an apartment building. Interpreting information from the results you've found write at least 4-5 sentences what you've found, what drives rental prices of apartments? Describe what things are important to take into account when deciding where to build, how to build, etc. k. (6 points) What kind of market is real estate development? Describe how you believe the market functions (how competitive it is, compare contrast the market's characteristics with the defined characteristics of competitive markets and how that would affect your pricing decisions). ECON 301 Managerial Economics Exam 1 Example Summary Statistics Variable Motel Occupancy Rate Room price Competitor price Income District Sherman Hill Downtown East Village Description % monthly rate in US $'s Intercept Room price Competitor price Income in US $'s in 000s of US $'s % of sample Mean 0.56 76.00 Coefficient 50.174 0.144 -0.083 0.026 75.64 62.74 ECON 301 Managerial Economics Exam 1 Example Linear Regression Results Dependent Variable: Motel Occupancy Rate (%) Standard 10% 80% 10% Std Dev 0.02 4.65 14.44 11.10 Error 7.847 0.117 0.041 -2,007 0.064 0.404 t stat p-value 0.000 0.230 0.058 0.690 Min 0.53 67.45 39.20 42.90 6.394 1.235 Max 0.60 83.90 83.90 83.90 These are false numbers I made up for an example
Expert Answer:

Related Book For 
Fundamentals of Corporate Finance
ISBN: 978-0077861629
8th edition
Authors: Richard Brealey, Stewart Myers, Alan Marcus
Posted Date:
Students also viewed these accounting questions
-
In Appendix A, you will find a table titled 10-Year Summary of Financial and Operating Results for Home Depot. Review the various performance measures listed in the table. Choose at least one measure...
-
In Appendix A, you will find a table titled "Five-Year Summary of Financial and Operating Results" for Home Depot. Review the various performance measures listed in the table. Choose at least one...
-
Determine taxable income. Show all adjustments in the Microsoft Excel spreadsheet. Footnote references are provided to assist you. 1. 2. The Dr. has filed his prior tax returns on the cash basis. a....
-
Nanette works for Piroz and is paid a basic wage of $1,000 a week. Piroz operates the following bonus scheme: (1) Each employee gets a bonus of $4 for every unit they produce in excess of 2,000 units...
-
The Maple Lake branch of Buffalo State Savings Bank (BSSB) is a retail branch in a rapidly growing residential area. It services individuals and local businesses. To support its services, the branch...
-
A point source with luminous intensity I0 = 100 cd is positioned at a distance s = 20.0 cm from the crest of a concave mirror with focal length f = 25.0 cm. Find the luminous intensity of the...
-
The four alternatives described below are being evaluated: The Incremental IRRs are: a. If the alternatives are independent, which one(s) should be selected if \(M A R R=15.5\) percent/year? b. If...
-
On July 1, 2016, Sean McConnell established his own accounting practice. Selected transactions for the first few days of July follow. DATETRANSACTIONS July 1Signed a lease for an office and issued...
-
Discuss in detail some of the most common mistakes made when administering a database? Who is responsible for completing tasks needed to administer the database? What could have been done differently...
-
Ben Tools, Inc.s comparative balance sheets for December 31, 2014 and 2013, follow. During 2014, the company had net income of $96,000 and building and equipment depreciation expenses of $80,000 and...
-
The debit for non-refundable purchase tax correctly calculated and paid on the purchase of machinery should be included in A. Purchase Taxe Expense. B. Machinery. C. Accumulated Depreciation...
-
Describe a time when you had the opportunity to delegate a task to an employee or a task was delegated to you by another employee. What were some of the lessons (favorable or unfavorable) you gained...
-
es Exercise 11-9 (Algo) Calculate operating activities-indirect method (LO11-3) Portions of the financial statements for Peach Computer are provided below. Net sales Expenses: PEACH COMPUTER Income...
-
Your company is considering paying a commission to the sales force to expand sales. You are charged by the Chief Financial Officer with 1) computing a new breakeven point, and 2) the operating profit...
-
Let F(x) = f(f(x)) and G(x) = (F(x)). You also know that f(9) = 13, f(13) = 3, f'(13) = 2, f'(9) = 9 Find F'(9) = and G'(9) =
-
Goodtime Food Products Ltd. produces processed foods including pickles, relish and canned vegetables. The production workers are covered by a collective agreement. Six months ago the company...
-
Sheri is a lawyer who operates as a sole practitioner. Despite her busy schedule in the past, Sheri found time for her family. This year Sheri took on two new important clients, and she hired a...
-
Juarez worked for Westarz Homes at construction sites for five years. Bever was a superintendent at construction sites, supervising subcontractors and moving trash from sites to landfills. He...
-
In each of the following cases, state which of the two companies is likely to be characterized by the higher ratio. a. Debt-equity ratio: a shipping company or a computer software company b. Payout...
-
A project has a life of 10 years and a payback period of 10 years. What must be true of project NPV?
-
A new furnace for your small factory will cost $27,000 a year to install and will require ongoing maintenance expenditures of $1,500 a year. But it is far more fuel- efficient than your old furnace...
-
a. Show that the mean-squared forecast error \(E\left[\left(\hat{y}_{T+1}-y_{T+1} ight)^{2} \mid I_{T} ight]\) for a forecast \(\hat{y}_{T+1}\), that depends only on past information \(I_{T}\), can...
-
Consider the AR(1) model \(y_{t}=\delta+\theta y_{t-1}+e_{t}\) where \(|\theta|)=0\) and \(\operatorname{var}\left(e_{t} \mid I_{t-1} ight)=\sigma^{2}\). Let \(\bar{y}_{-1}=\sum_{t=2}^{T} y_{t}...
-
Consider a stationary model that combines the \(\operatorname{AR}(2)\) model \(y_{t}=\delta+\theta_{1} y_{t-1}+\theta_{2} y_{t-2}+e_{t}\) with an \(\mathrm{AR}(1)\) error model \(e_{t}=ho...

Study smarter with the SolutionInn App