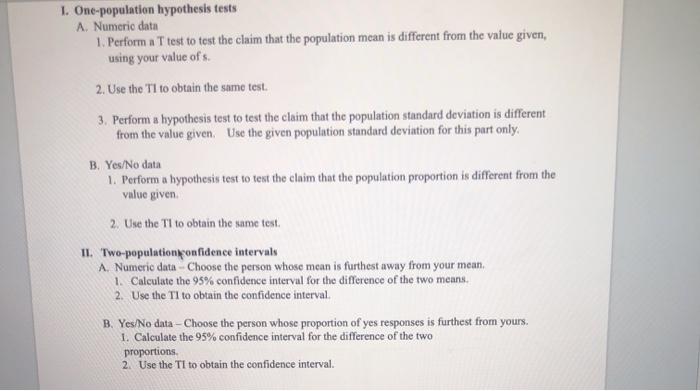
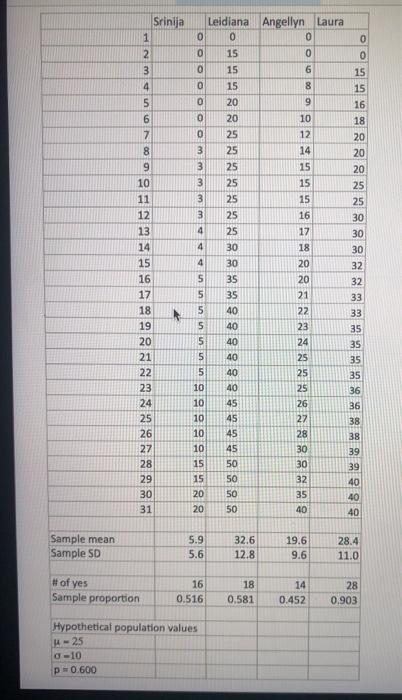
1. One-population hypothesis tests. A. Numeric data 1. Perform a T test to test the claim...
Fantastic news! We've Found the answer you've been seeking!
Question:
Transcribed Image Text:
1. One-population hypothesis tests. A. Numeric data 1. Perform a T test to test the claim that the population mean is different from the value given, using your value of s. 2. Use the TI to obtain the same test. 3. Perform a hypothesis test to test the claim that the population standard deviation is different from the value given. Use the given population standard deviation for this part only. B. Yes/No data 1. Perform a hypothesis test to test the claim that the population proportion is different from the value given. 2. Use the TI to obtain the same test. II. Two-population confidence intervals A. Numeric data-Choose the person whose mean is furthest away from your mean. 1. Calculate the 95% confidence interval for the difference of the two means. 2. Use the TI to obtain the confidence interval. B. Yes/No data-Choose the person whose proportion of yes responses is furthest from yours. 1. Calculate the 95% confidence interval for the difference of the two proportions. 2. Use the TI to obtain the confidence interval. Note: For all hypothesis tests, use a = 0.05. Sample mean Sample SD 123&ST690 4 5 7 8 10 11 12 13 14 15 16 17 18 19 20 21 22 23 24 #of yes Sample proportion 25 26 27 28 29 30 31 Srinija Leidiana Angellyn Laura 72 0 0 0 3 4 4 4 5 0 15 0 0 0 3 3 3 3 5 5 5 555999994488 15 10 10 10 10 10 15 15 20 20 5.9 55 5.6 OSSER 84454554883599999944448888 15 Hypothetical population values 44-25 0-10 p= 0.600 15 20 20 25 25 25 25 25 25 25 30 30 40 40 40 40 40 40 50 50 50 50 32.6 12.8 16 18 0.516 0.581 88689 ON HS44SA98 10 12 14 15 15 15 16 17 18 20 20 21 22 23 24 25 25 25 26 27 28 30 30 32 35 40 19.6 9.6 14 0.452 0 0 15 15 6 28 20 20 20 25 25 30 30 30 2 32 33 33 35 35 35 35 36 35 8 8 9 卫 0 0 0 16 18 32 36 38 38 39 39 40 40 40 28.4 11.0 28 0.903 1. One-population hypothesis tests. A. Numeric data 1. Perform a T test to test the claim that the population mean is different from the value given, using your value of s. 2. Use the TI to obtain the same test. 3. Perform a hypothesis test to test the claim that the population standard deviation is different from the value given. Use the given population standard deviation for this part only. B. Yes/No data 1. Perform a hypothesis test to test the claim that the population proportion is different from the value given. 2. Use the TI to obtain the same test. II. Two-population confidence intervals A. Numeric data-Choose the person whose mean is furthest away from your mean. 1. Calculate the 95% confidence interval for the difference of the two means. 2. Use the TI to obtain the confidence interval. B. Yes/No data-Choose the person whose proportion of yes responses is furthest from yours. 1. Calculate the 95% confidence interval for the difference of the two proportions. 2. Use the TI to obtain the confidence interval. Note: For all hypothesis tests, use a = 0.05. Sample mean Sample SD 123&ST690 4 5 7 8 10 11 12 13 14 15 16 17 18 19 20 21 22 23 24 #of yes Sample proportion 25 26 27 28 29 30 31 Srinija Leidiana Angellyn Laura 72 0 0 0 3 4 4 4 5 0 15 0 0 0 3 3 3 3 5 5 5 555999994488 15 10 10 10 10 10 15 15 20 20 5.9 55 5.6 OSSER 84454554883599999944448888 15 Hypothetical population values 44-25 0-10 p= 0.600 15 20 20 25 25 25 25 25 25 25 30 30 40 40 40 40 40 40 50 50 50 50 32.6 12.8 16 18 0.516 0.581 88689 ON HS44SA98 10 12 14 15 15 15 16 17 18 20 20 21 22 23 24 25 25 25 26 27 28 30 30 32 35 40 19.6 9.6 14 0.452 0 0 15 15 6 28 20 20 20 25 25 30 30 30 2 32 33 33 35 35 35 35 36 35 8 8 9 卫 0 0 0 16 18 32 36 38 38 39 39 40 40 40 28.4 11.0 28 0.903
Expert Answer:
Answer rating: 100% (QA)
Certainly Lets go through each part step by step A Numeric Data 1 TTest Null hypothesis H0 0 population mean is equal to the given value Alternative hypothesis Ha 0 population mean is different from t... View the full answer
Related Book For
Understanding Basic Statistics
ISBN: 978-1111827021
6th edition
Authors: Charles Henry Brase, Corrinne Pellillo Brase
Posted Date:
Students also viewed these accounting questions
-
The data set Emission provides hydrocarbon emission in parts per million (ppm) at idling speed for cars, based on the year each car was manufactured. These data were randomly sampled from a much...
-
Data set: PaperTowel As a final project in an introductory statistics class, several students decided to conduct a study to test the strength of paper towels. Television advertisements had claimed...
-
To compare the dry braking distances from 30 to 0 miles per hour for two makes of automobiles, a safety engineer conducts braking tests for 35 models of Make A and 35 models of Make B. The mean...
-
Multiple domains have been identified that comprise human systems integration. Typically, it has not been possible to address each domain completely in the process of a comprehensive systems design....
-
During 2014, Roblez Corporation had the following transactions and events. 1. Declared a cash dividend. 2. Issued par value common stock for cash at par value. 3. Completed a 2-for-1 stock split in...
-
What strategies can MNCs adopt to cope with product piracy?
-
Bank of America lent $100,000 to Christine Kleuters on a 90-day, 8% note. Record the following transactions for Bank of America (explanations are not required): 1. Lending the money on June 12. 2....
-
A study by Becker Associates, a San Diego travel consultant, found that 30% of the traveling public said that their flight selections are influenced by perceptions of airline safety. Thirty-nine...
-
Has this CEO crossed the line and created a toxic rather than high performing work environment? Explain. 2- What is top piece of advice to make performance evaluation fair and unbiased? 3- Should HR...
-
PROBLEM 2.60 Two cables tied together at C are loaded as shown. Determine the range of values of P for which both cables remain taut. 300 W 120 lb
-
QUESTION 5 Suppose a bank has $100 million in assets, $80 million in liabilities (excluding Bank Capital), and $20 million in Bank Capital. The average duration of assets 3.5 years, and the average...
-
Discuss the importance of validity and research design. Next, choose one type of validity (internal, external, construct, or statistical conclusion) and discuss its relevance to experimental, quasi...
-
What is the major difference between a cross-sectional and a longitudinal design?
-
Define a sampling strategy.
-
Describe some of the threats to external validity that are common with the survey approach.
-
Define the two major types of sampling strategies .
-
Case: Global Asset Allocation Whither the US Dollar? Suggested Questions 1. Give brief history of the performance of the USD vs. other currencies. 2. Describe the decision facing Ms. Williams. 3. Is...
-
Why should you not model a decision variable as a random variable with a probability distribution?
-
Sketch the areas under the standard normal curve over the indicated intervals and find the specified areas. Between z = 1.98 and z = 0.03
-
Bill Alther is a zoologist who studies Annas hummingbirds (Calypte anna). Suppose that in a remote part of the Grand Canyon, a random sample of six of these birds was caught, weighed, and released....
-
More than a decade ago, high levels of lead in the blood put 88% of children at risk. A concerted effort was made to remove lead from the environment. Now, according to the Third National Health and...
-
Will you accept the following as good voucher? (a) A bill of Rs. 5,000 submitted by a salesman for his travelling allowance (b) A cash memo for Rs. 500 for a perambulator of a company producing...
-
How do you vouch the following? (a) Custom duty paid on import of machinery (b) Income from house property (c) Royalty payable to a foreign collaborator (d) Traveling expenses (e) Interest and...
-
What are the differences between auditing and accountancy?
Study smarter with the SolutionInn App