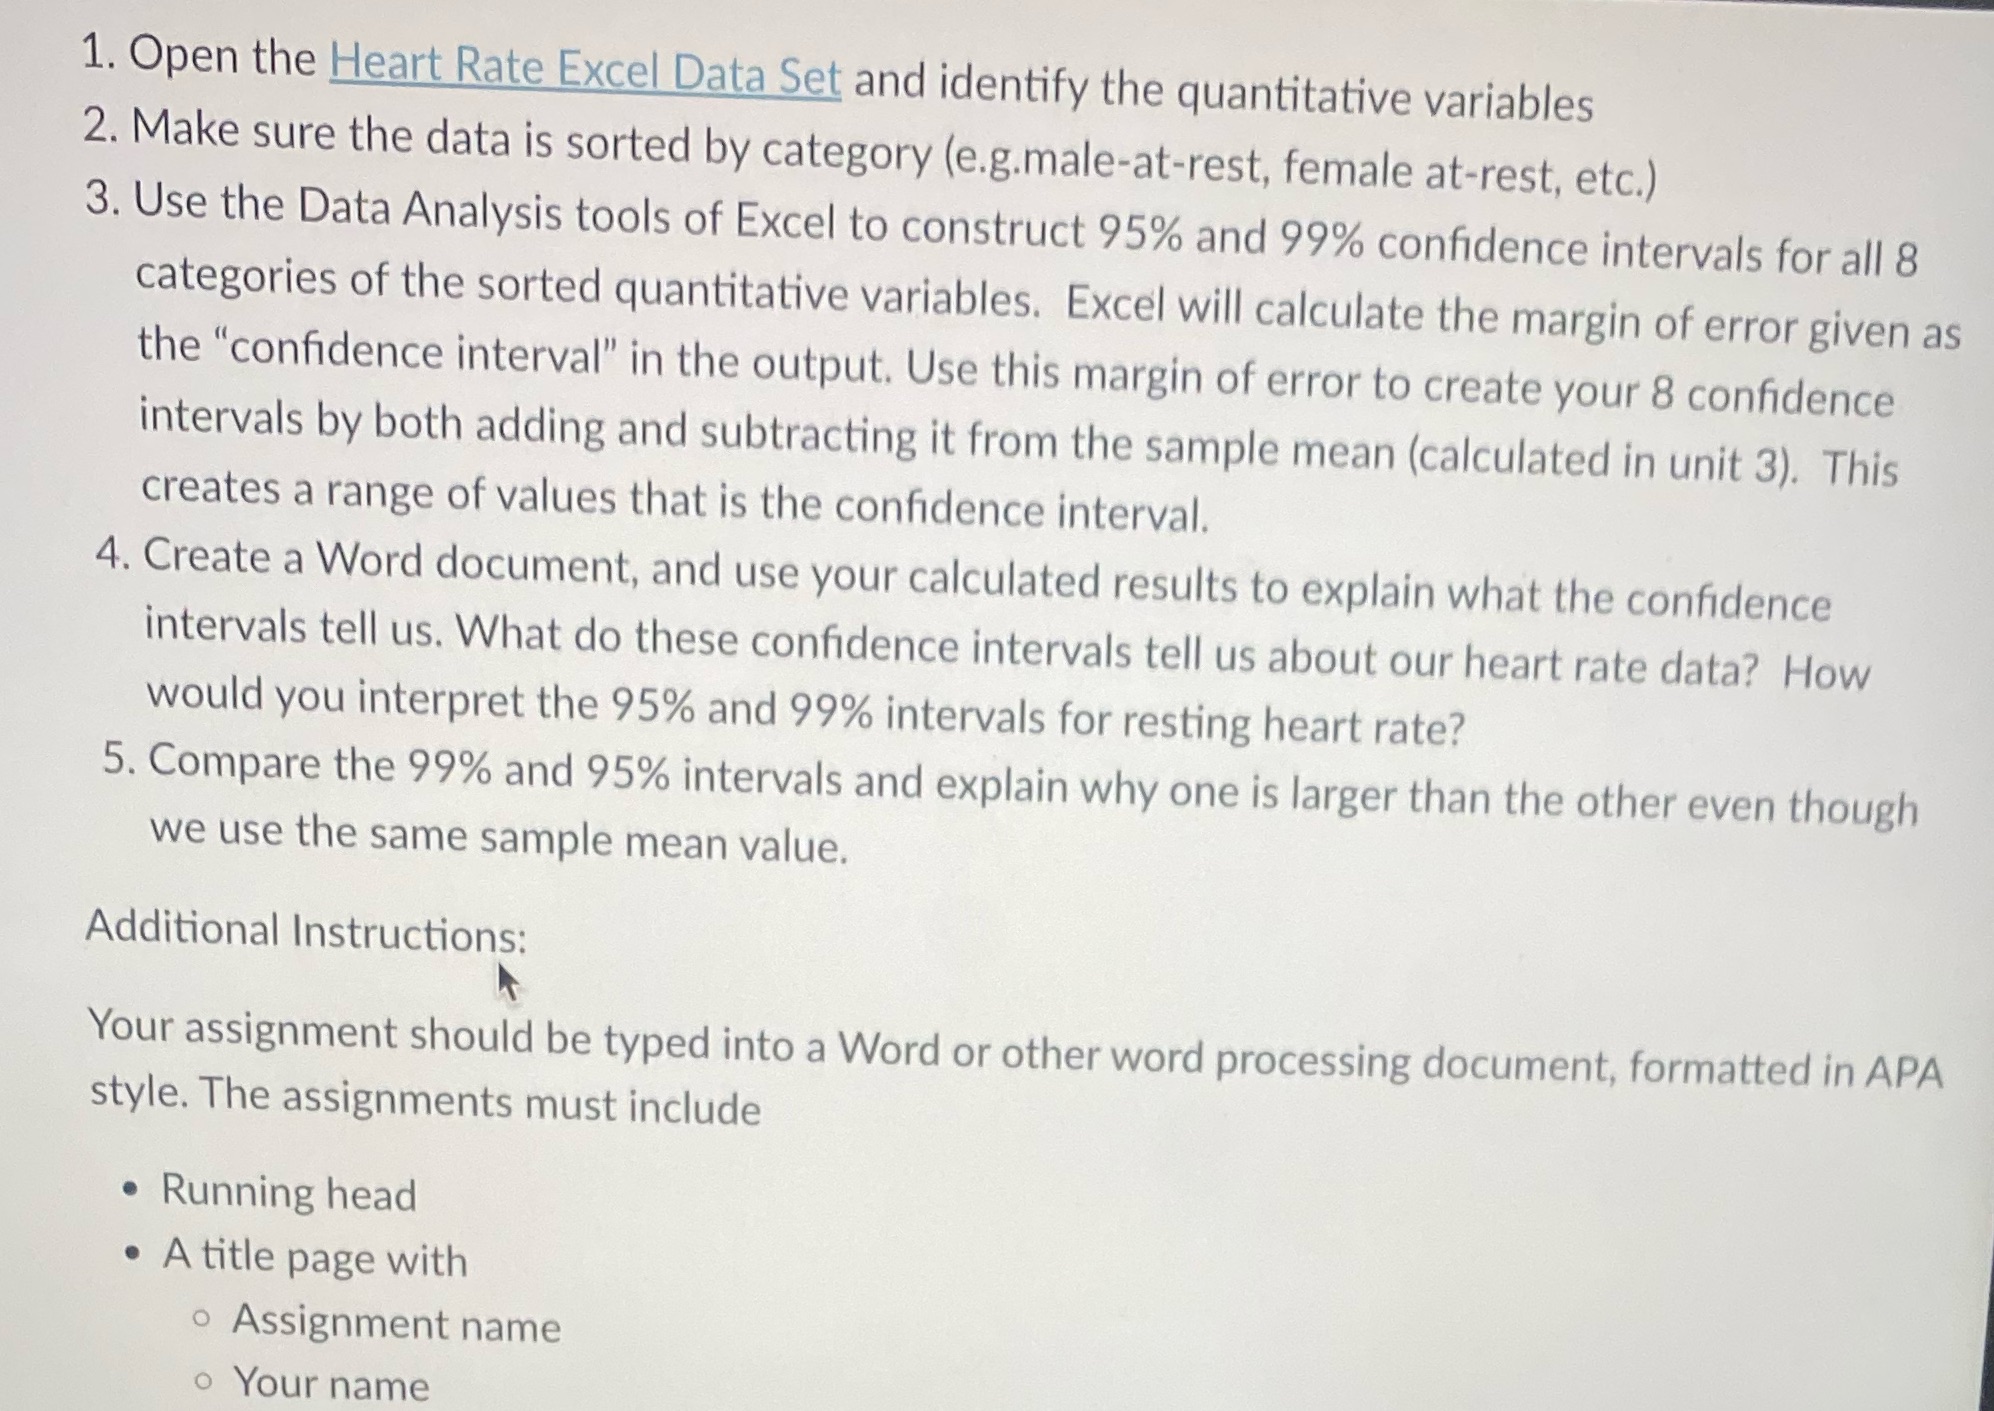
1. Open the Heart Rate Excel Data Set and identify the quantitative variables 2. Make sure...
Fantastic news! We've Found the answer you've been seeking!
Question:
Transcribed Image Text:
1. Open the Heart Rate Excel Data Set and identify the quantitative variables 2. Make sure the data is sorted by category (e.g.male-at-rest, female at-rest, etc.) 3. Use the Data Analysis tools of Excel to construct 95% and 99% confidence intervals for all 8 categories of the sorted quantitative variables. Excel will calculate the margin of error given as the "confidence interval" in the output. Use this margin of error to create your 8 confidence intervals by both adding and subtracting it from the sample mean (calculated in unit 3). This creates a range of values that is the confidence interval. 4. Create a Word document, and use your calculated results to explain what the confidence intervals tell us. What do these confidence intervals tell us about our heart rate data? How would you interpret the 95% and 99% intervals for resting heart rate? 5. Compare the 99% and 95% intervals and explain why one is larger than the other even though we use the same sample mean value. Additional Instructions: Your assignment should be typed into a Word or other word processing document, formatted in APA style. The assignments must include . Running head A title page with o Assignment name Your name 1. Open the Heart Rate Excel Data Set and identify the quantitative variables 2. Make sure the data is sorted by category (e.g.male-at-rest, female at-rest, etc.) 3. Use the Data Analysis tools of Excel to construct 95% and 99% confidence intervals for all 8 categories of the sorted quantitative variables. Excel will calculate the margin of error given as the "confidence interval" in the output. Use this margin of error to create your 8 confidence intervals by both adding and subtracting it from the sample mean (calculated in unit 3). This creates a range of values that is the confidence interval. 4. Create a Word document, and use your calculated results to explain what the confidence intervals tell us. What do these confidence intervals tell us about our heart rate data? How would you interpret the 95% and 99% intervals for resting heart rate? 5. Compare the 99% and 95% intervals and explain why one is larger than the other even though we use the same sample mean value. Additional Instructions: Your assignment should be typed into a Word or other word processing document, formatted in APA style. The assignments must include . Running head A title page with o Assignment name Your name
Expert Answer:
Posted Date:
Students also viewed these mathematics questions
-
Soft Glow, Inc. manufactures light bulbs. Their purchasing policy requires that the purchasing agents place each quarter's purchasing requirements out for bid. This is because the Purchasing...
-
When is it acceptable to use the direct write-off method of accounting for uncollectible accounts?
-
Wastewater containing dissolved hydrogen sulfide (H 2 S) at concentration of 2.50 gmole/m 3 (85 mg/L) enters an open tank at a volumetric flow rate of 20 m 3 /h, and exits at the same volumetric flow...
-
Northwest Inc. has gathered the following data on the number of shipments received and the cost of receiving reports for the first seven weeks of the year. a. Using the high-low method, develop the...
-
Rolfe Company (a U.S.-based company) has a subsidiary in Nigeria where the local currency unit is the naira (NGN). On December 31, 2016, the subsidiary had the following balance sheet (amounts are in...
-
5-33. Methods of Estimating Costs: High-Low (LO 5-4) Adriana Corporation manufactures football equipment. In planning for next year, the manag- ers want to understand the relation between activity...
-
LeBron James (#23) plays small forward for the Los Angeles Lakers. LeBron is not small. That's just the name of his position. Here are LeBron's personal point totals for the 25 games the Lakers...
-
This lab practices with inheritance and function overriding by having you create characters from the game "Among Us". We provide a very basic gameplay in main.cc, and you do not need to edit this...
-
The following are historical demand data: ACTUAL YEAR 2011 SEASON DEMAND Spring 205 Summer 151 Fall 379 Winter 560 2012 Spring 481 Summer 268 Fall Winter 679 959 Use regression analysis on...
-
Wildhorse Company accumulates the following data concerning a mixed cost, using miles as the activity level. Miles Driven Total Miles Total Cost Driven Cost January 7,995 $14,145 March 8,500 $14,891...
-
In a tug-of-war game on one campus, 15 students pull on a rope at both ends in an effort to displace the central knot to one side or the other. Two students pull with force 198 N each to the right,...
-
Gable Company uses three activity cost pools. Each pool has a cost driver. Information for Gable Company follows: Activity Cost Pools Machining Designing costs Setup costs Total Cost Cost Driver of...
-
ALSONA Consulting Ltd. ALSONA Consulting Ltd. Is a privately held company established by the two principals in 2000. These two ambitious leaders managed to combine since yearly days two passions:...
-
The company manufactures three products: wooden chairs, tables and dressers. AFC started off as a 'Mom & Pop' shop but has grown rapidly. AFC uses one assembly line to build all three products,...
Study smarter with the SolutionInn App