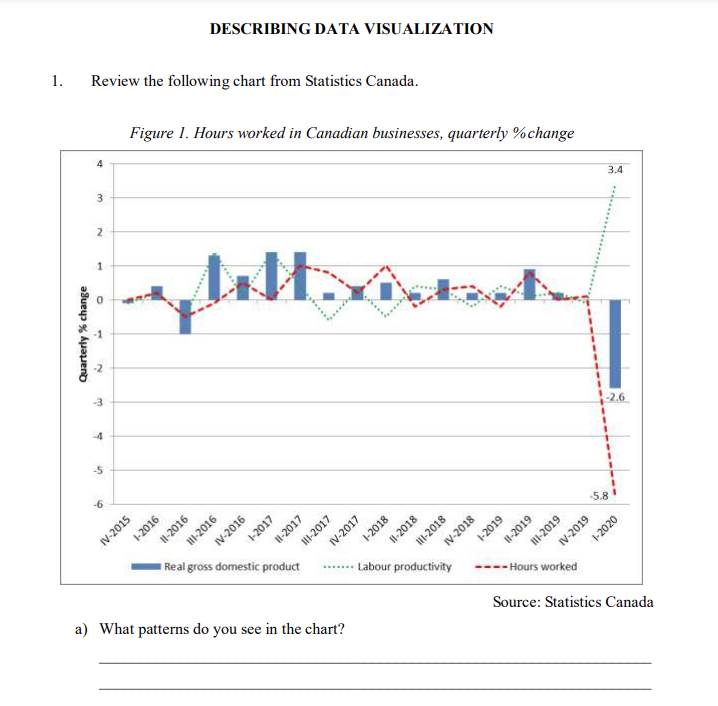
1. Quarterly % change Review the following chart from Statistics Canada. 4 3 2 1 O...
Fantastic news! We've Found the answer you've been seeking!
Question:
Transcribed Image Text:
1. Quarterly % change Review the following chart from Statistics Canada. 4 3 2 1 O 1 N -3 -4 -5 6 Figure 1. Hours worked in Canadian businesses, quarterly % change IV-2015 DESCRIBING DATA VISUALIZATION 1-2016 11-2016 III-2016 IV-2016 1-2017 11-2017 11-2017 Real gross domestic product a) What patterns do you see in the chart? IV-2017 1-2018 Il-2018 III-2018 IV-2018 1-2019 Labour productivity 11-2019 III-2019 IV-2019 -- Hours worked 3.4 -2.6 -5.8 1-2020 Source: Statistics Canada b) Complete the description of the chart. Figure 1 shows (a)............. productivity of Canadian businesses (b) quarterly increase recorded, as hours worked (c) output. Following measures taken in March to stop the spread of COVID-19, 1 Labour ...... in the first quarter, the largest faster than business including lockdown and the temporary closure of many businesses, output and hours worked both (d.......................... ... the (..).................However, hours worked fell more sharply than business output, resulting in a strong overall productivity (f). The many closures imposed by governments to contain the COVID-19 virus led to record employment (g................ compounded by (h)................. in hours worked per job. As business output did not (i). ............ in the same proportion as hours worked, this led to an unprecedented increase in (j))...... (k).. of businesses fell 2.6%, reflecting the impact of the COVID-19 pandemic in mid-March, along with other factors earlier in the quarter. Output fell in both goods-producing businesses (-1.1%) and service-producing businesses (-2.5%). The sectors most affected were arts, entertainment and recreation (-14.4%), accommodation and food services (-13.1%) and transportation and warehousing (-5.2%). Meanwhile, (1)..................... the business sector fell 5.8%, surpassing the previous record decline of 2.9% during the 2008/2009 financial crisis. Source: Statistics Canada 1. Quarterly % change Review the following chart from Statistics Canada. 4 3 2 1 O 1 N -3 -4 -5 6 Figure 1. Hours worked in Canadian businesses, quarterly % change IV-2015 DESCRIBING DATA VISUALIZATION 1-2016 11-2016 III-2016 IV-2016 1-2017 11-2017 11-2017 Real gross domestic product a) What patterns do you see in the chart? IV-2017 1-2018 Il-2018 III-2018 IV-2018 1-2019 Labour productivity 11-2019 III-2019 IV-2019 -- Hours worked 3.4 -2.6 -5.8 1-2020 Source: Statistics Canada b) Complete the description of the chart. Figure 1 shows (a)............. productivity of Canadian businesses (b) quarterly increase recorded, as hours worked (c) output. Following measures taken in March to stop the spread of COVID-19, 1 Labour ...... in the first quarter, the largest faster than business including lockdown and the temporary closure of many businesses, output and hours worked both (d.......................... ... the (..).................However, hours worked fell more sharply than business output, resulting in a strong overall productivity (f). The many closures imposed by governments to contain the COVID-19 virus led to record employment (g................ compounded by (h)................. in hours worked per job. As business output did not (i). ............ in the same proportion as hours worked, this led to an unprecedented increase in (j))...... (k).. of businesses fell 2.6%, reflecting the impact of the COVID-19 pandemic in mid-March, along with other factors earlier in the quarter. Output fell in both goods-producing businesses (-1.1%) and service-producing businesses (-2.5%). The sectors most affected were arts, entertainment and recreation (-14.4%), accommodation and food services (-13.1%) and transportation and warehousing (-5.2%). Meanwhile, (1)..................... the business sector fell 5.8%, surpassing the previous record decline of 2.9% during the 2008/2009 financial crisis. Source: Statistics Canada
Expert Answer:
Related Book For
An Introduction To Statistical Methods And Data Analysis
ISBN: 9781305465527
7th Edition
Authors: R. Lyman Ott, Micheal T. Longnecker
Posted Date:
Students also viewed these economics questions
-
The following additional information is available for the Dr. Ivan and Irene Incisor family from Chapters 1-5. Ivan's grandfather died and left a portfolio of municipal bonds. In 2012, they pay Ivan...
-
Emily Jackson (Social Security number 765-12-4326) and James Stewart (Social Security number 466-74-9932) are partners in a partnership that owns and operates a barber shop. The partnership's first...
-
At t = 0, a particle is traveling parallel to very large insulating plate at a 0.360 m distance with a speed of 980 m/s. Consider that the insulating plate has uniform surface charge density 2.34. x...
-
If velocity and aggregate output are reasonably constant (as the classical economists believed), what will happen to the price level when the money supply increases from $1 trillion to $4 trillion?
-
How many overtones are present within the audible range for a 2.14-m-long organ pipe at 20oC (a) If it is open, and (b) It is closed?
-
In Figure 7.7, consider the cart's initial speed to be \(v_{\mathrm{i}}\). Assuming no potential energy is initially stored in the spring, how much potential energy is stored in the spring at the...
-
Futura Furniture Products manufactures upscale office furniture for the Office of the Future. The sales division is comprised of regionally based sales offices made up of sales representatives and...
-
(a) (b) (c) Small business owners are discovering that social media marketing is quickly becoming an important method for driving business growth. While the idea of using "free tools" to drive...
-
Assume that the citizens can still build a water purification plant at $600 and the firm at $300, but the pollution damages are $100 instead of $1000. (a) If property rights are assigned to the...
-
Briefly describe the major characteristics of forecasts in supply chain management.
-
Is Dell adapting the pull or push processes, or a combination of the two, in its supply chain demand forecasting?
-
________ is a service factor performance characteristic of manufacturer or distributor storage with customer pickup that is lower than other options because of the lack of home delivery. Experience...
-
The demand allocation model requires the following input: number of factory locations. number of customers in each location. number of employees in total. number of destinations served by each...
-
Gravity models also assume that the transportation cost grows exponentially with the quantity shipped and the distance traveled. grows linearly with the quantity shipped and the distance traveled....
-
The gravitational field a distance r inside a spherical cloud of radius R and total mass M is given by g = - GN M 2 R' where GN is Newton's gravitational constant. The gravitational potential, , at a...
-
A circular concrete shaft liner with Youngs modulus of 3.4 million psi, Poissons ratio of 0.25, unconfined compressive strength 3,500 psi and tensile strength 350 psi is loaded to the verge of...
-
Refer to Exercise 7.18. In exercise a. The biologist hypothesized that the mean weight of deer raised in a zoo would differ from the mean weight of deer raised either in the wild or on a ranch. Do...
-
Refer to Exercise 13.74. a. Fit the data to the model of Exercise 13.74. b. Give separate regression models for each of the laboratories. c. How do these regression models compare to the previous...
-
An examination of the scatterplots in Exercise 3.62 reveals one patient with a very large value for baseline count and all subsequent counts. The patient has ID 207. a. Predict the effect of removing...
-
Redo the preceding exercise, this time using the mathematics scores. Preceding Exercise Use the reading comprehension data in Exercise 6.18 to test the null hypothesis that the population mean of X...
-
Which of the following is a cash outflow? (a) Proceeds from borrowing. (b) Repayments of debt principal. (c) Payment for taxes. (d) Both (b) and (c).
-
Which of the following is not a cash inflow? (a) Proceeds from borrowing. (b) Returns on interest-earning assets. (c) Payment of dividends. (d) Returns on equity securities.
Study smarter with the SolutionInn App