

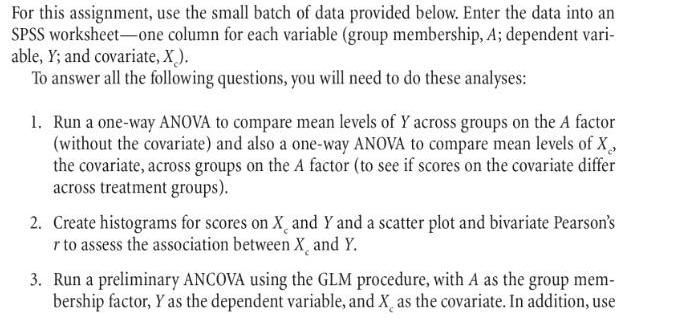
For this assignment, use the small batch of data provided below. Enter the data into an...
Fantastic news! We've Found the answer you've been seeking!
Question:
Transcribed Image Text:
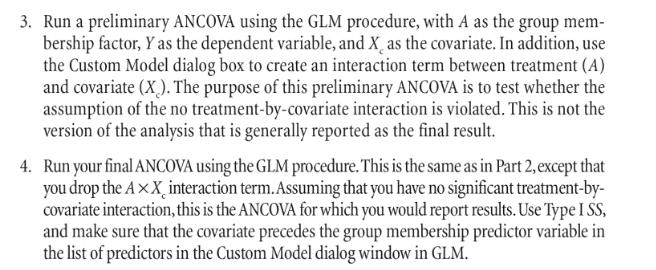
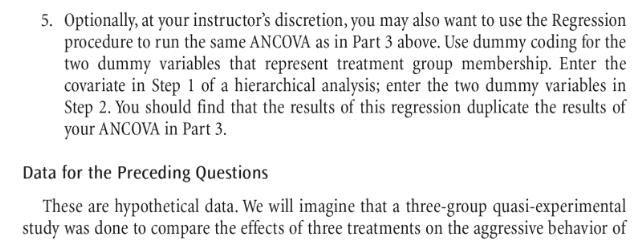
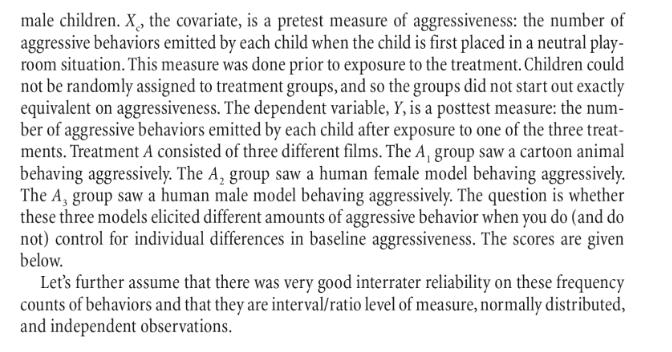
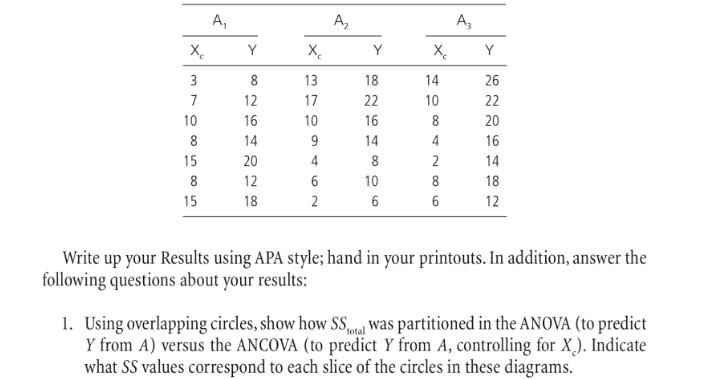
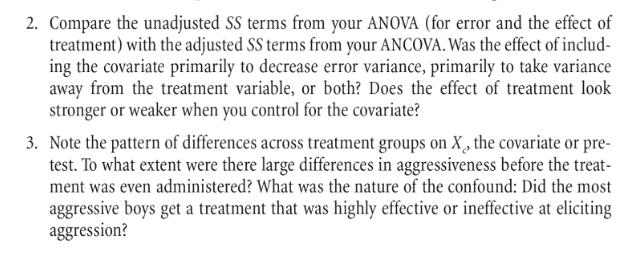
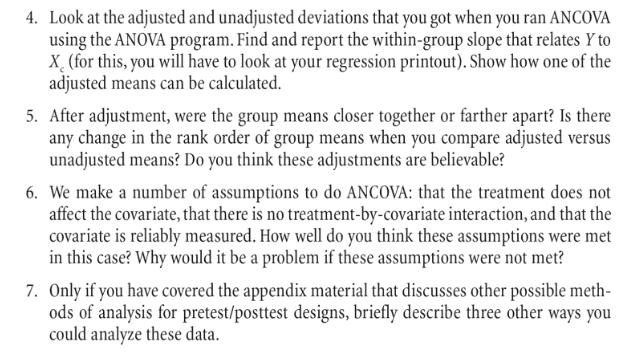
For this assignment, use the small batch of data provided below. Enter the data into an SPSS worksheet-one column for each variable (group membership, A; dependent vari- able, Y; and covariate, X). To answer all the following questions, you will need to do these analyses: 1. Run a one-way ANOVA to compare mean levels of Y across groups on the A factor (without the covariate) and also a one-way ANOVA to compare mean levels of X, the covariate, across groups on the A factor (to see if scores on the covariate differ across treatment groups). 2. Create histograms for scores on X and Y and a scatter plot and bivariate Pearson's r to assess the association between X and Y. 3. Run a preliminary ANCOVA using the GLM procedure, with A as the group mem- bership factor, Y as the dependent variable, and X, as the covariate. In addition, use 3. Run a preliminary ANCOVA using the GLM procedure, with A as the group mem- bership factor, Y as the dependent variable, and X as the covariate. In addition, use the Custom Model dialog box to create an interaction term between treatment (A) and covariate (X). The purpose of this preliminary ANCOVA is to test whether the assumption of the no treatment-by-covariate interaction is violated. This is not the version of the analysis that is generally reported as the final result. 4. Run your final ANCOVA using the GLM procedure. This is the same as in Part 2, except that you drop the AXX interaction term. Assuming that you have no significant treatment-by- covariate interaction, this is the ANCOVA for which you would report results. Use Type I SS, and make sure that the covariate precedes the group membership predictor variable in the list of predictors in the Custom Model dialog window in GLM. 5. Optionally, at your instructor's discretion, you may also want to use the Regression procedure to run the same ANCOVA as in Part 3 above. Use dummy coding for the two dummy variables that represent treatment group membership. Enter the covariate in Step 1 of a hierarchical analysis; enter the two dummy variables in Step 2. You should find that the results of this regression duplicate the results of your ANCOVA in Part 3. Data for the Preceding Questions These are hypothetical data. We will imagine that a three-group quasi-experimental study was done to compare the effects of three treatments on the aggressive behavior of male children. X, the covariate, is a pretest measure of aggressiveness: the number of aggressive behaviors emitted by each child when the child is first placed in a neutral play- room situation. This measure was done prior to exposure to the treatment. Children could not be randomly assigned to treatment groups, and so the groups did not start out exactly equivalent on aggressiveness. The dependent variable, Y, is a posttest measure: the num- ber of aggressive behaviors emitted by each child after exposure to one of the three treat- ments. Treatment A consisted of three different films. The A, group saw a cartoon animal behaving aggressively. The A, group saw a human female model behaving aggressively. The A, group saw a human male model behaving aggressively. The question is whether these three models elicited different amounts of aggressive behavior when you do (and do not) control for individual differences in baseline aggressiveness. The scores are given below. Let's further assume that there was very good interrater reliability on these frequency counts of behaviors and that they are interval/ratio level of measure, normally distributed, and independent observations. x² 3 7 10 8 15 8 15 A₁ Y 8 12 16 14 20 12 18 X₂ 13 17 10 9 4 6 2 A₂ Y 18 22 16 14 8 10 6 X₂ 14 10 084 2 8 6 A₂ Y 26 22 20 16 14 18 12 Write up your Results using APA style; hand in your printouts. In addition, answer the following questions about your results: 1. Using overlapping circles, show how SSotal was partitioned in the ANOVA (to predict Y from A) versus the ANCOVA (to predict Y from A, controlling for X). Indicate what SS values correspond to each slice of the circles in these diagrams. 2. Compare the unadjusted SS terms from your ANOVA (for error and the effect of treatment) with the adjusted SS terms from your ANCOVA. Was the effect of includ- ing the covariate primarily to decrease error variance, primarily to take variance away from the treatment variable, or both? Does the effect of treatment look stronger or weaker when you control for the covariate? 3. Note the pattern of differences across treatment groups on X, the covariate or pre- test. To what extent were there large differences in aggressiveness before the treat- ment was even administered? What was the nature of the confound: Did the most aggressive boys get a treatment that was highly effective or ineffective at eliciting aggression? 4. Look at the adjusted and unadjusted deviations that you got when you ran ANCOVA using the ANOVA program. Find and report the within-group slope that relates Y to X (for this, you will have to look at your regression printout). Show how one of the adjusted means can be calculated. 5. After adjustment, were the group means closer together or farther apart? Is there any change in the rank order of group means when you compare adjusted versus unadjusted means? Do you think these adjustments are believable? 6. We make a number of assumptions to do ANCOVA: that the treatment does not affect the covariate, that there is no treatment-by-covariate interaction, and that the covariate is reliably measured. How well do you think these assumptions were met in this case? Why would it be a problem if these assumptions were not met? 7. Only if you have covered the appendix material that discusses other possible meth- ods of analysis for pretest/posttest designs, briefly describe three other ways you could analyze these data. For this assignment, use the small batch of data provided below. Enter the data into an SPSS worksheet-one column for each variable (group membership, A; dependent vari- able, Y; and covariate, X). To answer all the following questions, you will need to do these analyses: 1. Run a one-way ANOVA to compare mean levels of Y across groups on the A factor (without the covariate) and also a one-way ANOVA to compare mean levels of X, the covariate, across groups on the A factor (to see if scores on the covariate differ across treatment groups). 2. Create histograms for scores on X and Y and a scatter plot and bivariate Pearson's r to assess the association between X and Y. 3. Run a preliminary ANCOVA using the GLM procedure, with A as the group mem- bership factor, Y as the dependent variable, and X, as the covariate. In addition, use 3. Run a preliminary ANCOVA using the GLM procedure, with A as the group mem- bership factor, Y as the dependent variable, and X as the covariate. In addition, use the Custom Model dialog box to create an interaction term between treatment (A) and covariate (X). The purpose of this preliminary ANCOVA is to test whether the assumption of the no treatment-by-covariate interaction is violated. This is not the version of the analysis that is generally reported as the final result. 4. Run your final ANCOVA using the GLM procedure. This is the same as in Part 2, except that you drop the AXX interaction term. Assuming that you have no significant treatment-by- covariate interaction, this is the ANCOVA for which you would report results. Use Type I SS, and make sure that the covariate precedes the group membership predictor variable in the list of predictors in the Custom Model dialog window in GLM. 5. Optionally, at your instructor's discretion, you may also want to use the Regression procedure to run the same ANCOVA as in Part 3 above. Use dummy coding for the two dummy variables that represent treatment group membership. Enter the covariate in Step 1 of a hierarchical analysis; enter the two dummy variables in Step 2. You should find that the results of this regression duplicate the results of your ANCOVA in Part 3. Data for the Preceding Questions These are hypothetical data. We will imagine that a three-group quasi-experimental study was done to compare the effects of three treatments on the aggressive behavior of male children. X, the covariate, is a pretest measure of aggressiveness: the number of aggressive behaviors emitted by each child when the child is first placed in a neutral play- room situation. This measure was done prior to exposure to the treatment. Children could not be randomly assigned to treatment groups, and so the groups did not start out exactly equivalent on aggressiveness. The dependent variable, Y, is a posttest measure: the num- ber of aggressive behaviors emitted by each child after exposure to one of the three treat- ments. Treatment A consisted of three different films. The A, group saw a cartoon animal behaving aggressively. The A, group saw a human female model behaving aggressively. The A, group saw a human male model behaving aggressively. The question is whether these three models elicited different amounts of aggressive behavior when you do (and do not) control for individual differences in baseline aggressiveness. The scores are given below. Let's further assume that there was very good interrater reliability on these frequency counts of behaviors and that they are interval/ratio level of measure, normally distributed, and independent observations. x² 3 7 10 8 15 8 15 A₁ Y 8 12 16 14 20 12 18 X₂ 13 17 10 9 4 6 2 A₂ Y 18 22 16 14 8 10 6 X₂ 14 10 084 2 8 6 A₂ Y 26 22 20 16 14 18 12 Write up your Results using APA style; hand in your printouts. In addition, answer the following questions about your results: 1. Using overlapping circles, show how SSotal was partitioned in the ANOVA (to predict Y from A) versus the ANCOVA (to predict Y from A, controlling for X). Indicate what SS values correspond to each slice of the circles in these diagrams. 2. Compare the unadjusted SS terms from your ANOVA (for error and the effect of treatment) with the adjusted SS terms from your ANCOVA. Was the effect of includ- ing the covariate primarily to decrease error variance, primarily to take variance away from the treatment variable, or both? Does the effect of treatment look stronger or weaker when you control for the covariate? 3. Note the pattern of differences across treatment groups on X, the covariate or pre- test. To what extent were there large differences in aggressiveness before the treat- ment was even administered? What was the nature of the confound: Did the most aggressive boys get a treatment that was highly effective or ineffective at eliciting aggression? 4. Look at the adjusted and unadjusted deviations that you got when you ran ANCOVA using the ANOVA program. Find and report the within-group slope that relates Y to X (for this, you will have to look at your regression printout). Show how one of the adjusted means can be calculated. 5. After adjustment, were the group means closer together or farther apart? Is there any change in the rank order of group means when you compare adjusted versus unadjusted means? Do you think these adjustments are believable? 6. We make a number of assumptions to do ANCOVA: that the treatment does not affect the covariate, that there is no treatment-by-covariate interaction, and that the covariate is reliably measured. How well do you think these assumptions were met in this case? Why would it be a problem if these assumptions were not met? 7. Only if you have covered the appendix material that discusses other possible meth- ods of analysis for pretest/posttest designs, briefly describe three other ways you could analyze these data.
Expert Answer:
Answer rating: 100% (QA)
Results Descriptive Statistics Before conducting the analyses lets first examine the descriptive statistics for variables Y dependent variable and X covariate across the three treatment groups A A A G... View the full answer

Related Book For 

Posted Date:
Students also viewed these accounting questions
-
A study is conducted to compare mean cholesterol levels for individuals following a low carbohydrate diet for at least 6 months to individuals following a conventional (low fat low calorie) diet for...
-
A factorial experiment involving two levels of factor A and three levels of factor B resulted in the following data. Test for any significant main effects and any interaction. Use .05. Factor B...
-
A tilting level was used to run precise levels to a construction project benchmark from benchmark DAM, which had an elevation of 345.901 m. The line was run along a road that goes up a steep incline....
-
Raheem & Co. purchased a fixed asset on 1.4.2018 for Rs.2,50,000. Depreciation is to be provided @10% annually according to the Straight-line method. The books are closed on 31st March every year....
-
Mr. Kay Food Mart Incorporated, as lessee, enters into a lease agreement on July 1, 2016, to lease mobile refrigeration equipment from Pollet Products. The cost of the equipment to Pollet is $...
-
A firm has just increased its price by 5 percent over last years price, and it found that quantity sold remained the same. a. What is its price elasticity of demand? b. How would you calculate it? c....
-
What the differences are between arbitration and mediation?
-
As a second-year financial analyst for A.J. Straub Investments, you are performing an initial analysis on Reliant Pharmaceuticals. A difficulty youve encountered in making comparisons with its chief...
-
a)Identify the haircut that is applicable to an unrated BBB security during the crisis, and post (after) the crisis. Identify the haircut that is applicable to equity securities during the crisis,...
-
1. Suppose you wanted to predict Winnings ($) using only the number of poles won (Poles), the number of wins (Wins), the number of top five finishes (Top 5), or the number of top ten finishes (Top...
-
For the beam and loading shown in Figure 4, knowing that a = 2m, co = 100kN/m and E = 200 GPa. Determine a) the slope at support A b) the deflection at point C Use Method of Integration. Express your...
-
The accounts in the ledger of Nilles Consulting Co . are listed as follows. All accounts have normal balances. Line Item Description Amount Cash $ 5 , 5 0 0 Accounts Receivable 6 , 4 0 0 Prepaid...
-
Compare the total cross-grain lumber dimension in the structuralframe for a two story building in platform frame vs balloon frame.Why is it better to have smaller total cross-grain lumber dimensionin...
-
Jana Ltd s net profit for the year ended December 2 0 2 0 was KShs 4 . 6 million and it has 5 0 0 , 0 0 0 equity - classified preference shares. Each preference share provides for a cumulative...
-
Please see Below image with sub titles of presentation and answer below mentioned questions accordingly. TOPIC- Airbnb what are the key points of the presentation as you see them and as you collect...
-
16. Given the following Java class: Public class A { public int n = 1; public AO{ n = 10; } public A(int a)[ n=n+a; } public A(String s) { } public int fO{ return n; } What is the output of the...
-
Redfern Audio produces audio equipment including headphones. At the Campus Facility, it produces two wireless models, Standard and Enhanced, which differ both in the materials and components used and...
-
Consider the activities undertaken by a medical clinic in your area. Required 1. Do you consider a job order cost accounting system appropriate for the clinic? 2. Identify as many factors as possible...
-
More royalty: Construct a stem- and- leaf plot for the data in Exercise 8. In Exercise 8. 59 40 6758 56 28 4 49 65 68 43 64 33 46 35 49 40 12 32 52 55 15 42 69 58 48 54 67 51 49 67 76 8 67 71 81 68...
-
We cannot use the least-squares regression line to predict y from x. In these situations, statisticians often try to manipulate one or both of the variables to try to find a linear fit. This is...
-
Power: A test of Ho: p = 100 versus If f. p > 100 will be made at a significance level of a = 0.01. The population standard deviation is a = 50 and the sample size is n = 75. Find the power of the...
-
Explain the difference between dollar-value estimation and hypothesis testing in audit sampling. Which of the two is more common in auditing?
-
Under what condition is difference estimation more appropriate than ratio estimation?
-
Identify the relative advantages and disadvantages of probability-proportional-tosize sampling.

Study smarter with the SolutionInn App