

1. The Department of Labor in the United States is conducting a study to understand the...
Fantastic news! We've Found the answer you've been seeking!
Question:
Transcribed Image Text:
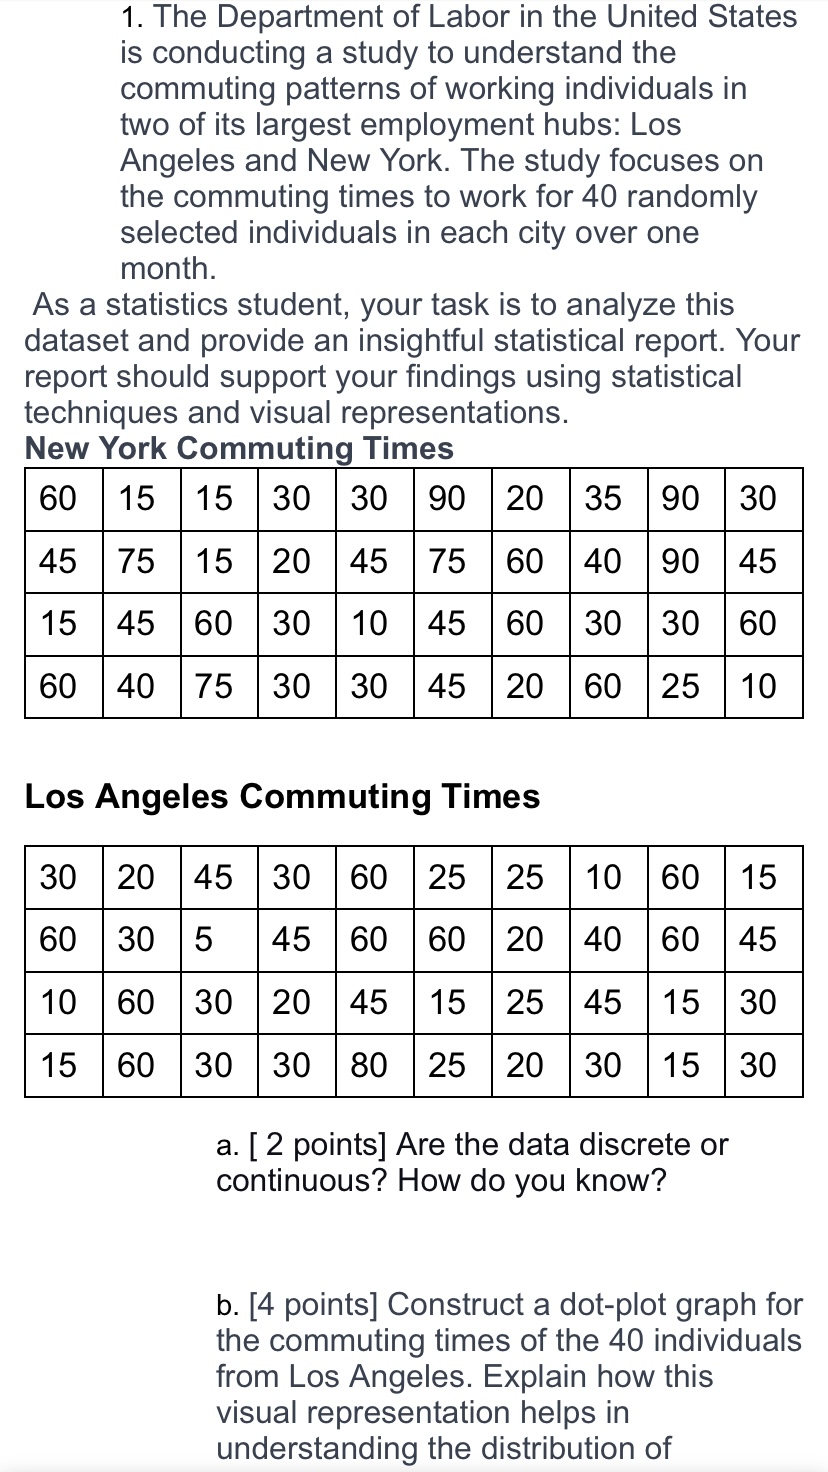
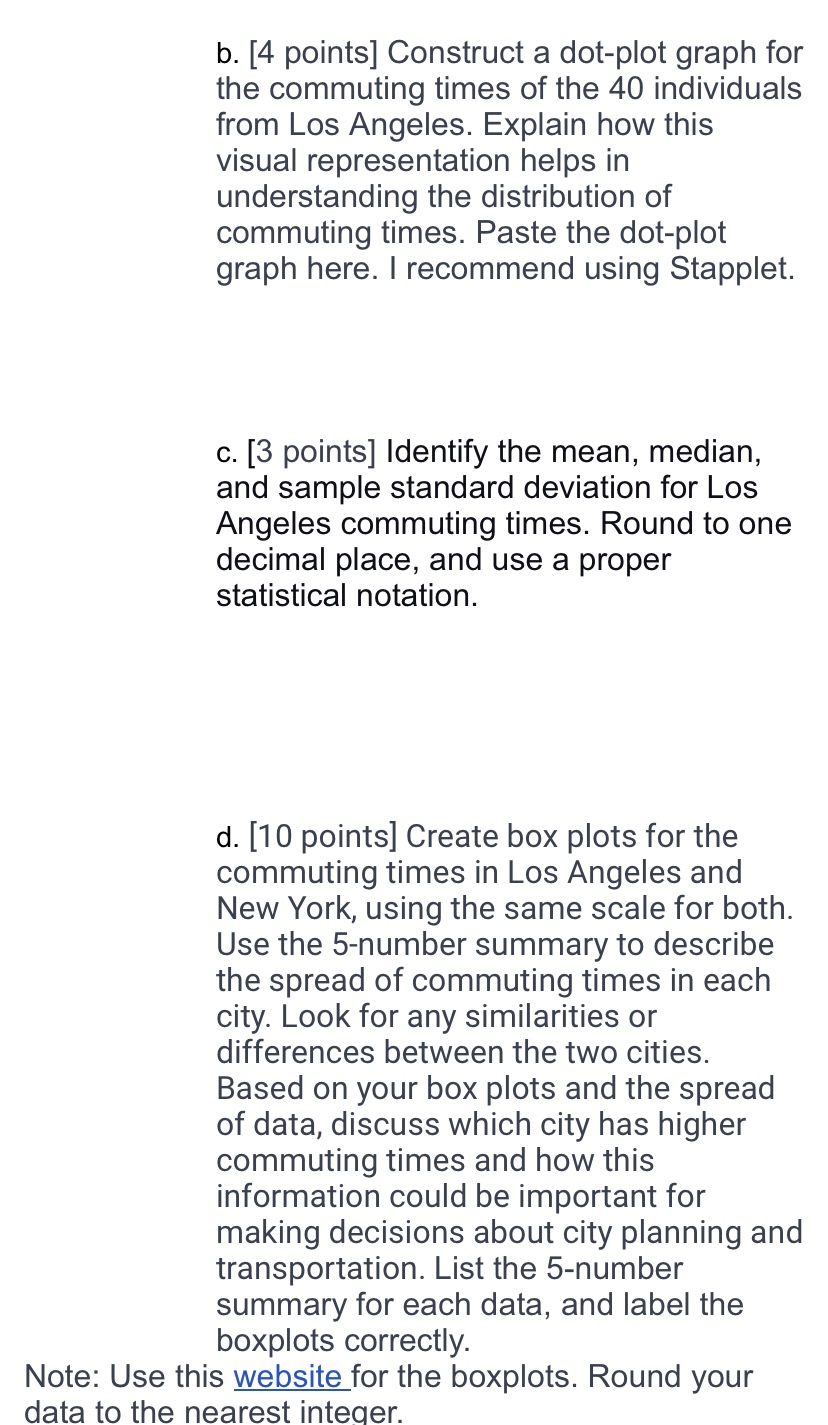
1. The Department of Labor in the United States is conducting a study to understand the commuting patterns of working individuals in two of its largest employment hubs: Los Angeles and New York. The study focuses on the commuting times to work for 40 randomly selected individuals in each city over one month. As a statistics student, your task is to analyze this dataset and provide an insightful statistical report. Your report should support your findings using statistical techniques and visual representations. New York Commuting Times 60 15 15 30 30 90 20 35 90 30 45 75 15 20 45 15 45 60 30 10 30 10 60 40 75 30 30 75 60 40 90 45 45 60 3030 60 45 45 20 60 25 10 Los Angeles Commuting Times 30 20 45 30 60 25 25 60 30 5 45 60 60 20 10 60 30 20 45 15 25 15 60 30 10 60 15 40 60 45 45 15 30 30 80 25 20 30 15 30 a. [2 points] Are the data discrete or continuous? How do you know? b. [4 points] Construct a dot-plot graph for the commuting times of the 40 individuals from Los Angeles. Explain how this visual representation helps in understanding the distribution of b. [4 points] Construct a dot-plot graph for the commuting times of the 40 individuals from Los Angeles. Explain how this visual representation helps in understanding the distribution of commuting times. Paste the dot-plot graph here. I recommend using Stapplet. c. [3 points] Identify the mean, median, and sample standard deviation for Los Angeles commuting times. Round to one decimal place, and use a proper statistical notation. d. [10 points] Create box plots for the commuting times in Los Angeles and New York, using the same scale for both. Use the 5-number summary to describe the spread of commuting times in each city. Look for any similarities or differences between the two cities. Based on your box plots and the spread of data, discuss which city has higher commuting times and how this information could be important for making decisions about city planning and transportation. List the 5-number summary for each data, and label the boxplots correctly. Note: Use this website for the boxplots. Round your data to the nearest integer. 1. The Department of Labor in the United States is conducting a study to understand the commuting patterns of working individuals in two of its largest employment hubs: Los Angeles and New York. The study focuses on the commuting times to work for 40 randomly selected individuals in each city over one month. As a statistics student, your task is to analyze this dataset and provide an insightful statistical report. Your report should support your findings using statistical techniques and visual representations. New York Commuting Times 60 15 15 30 30 90 20 35 90 30 45 75 15 20 45 15 45 60 30 10 30 10 60 40 75 30 30 75 60 40 90 45 45 60 3030 60 45 45 20 60 25 10 Los Angeles Commuting Times 30 20 45 30 60 25 25 60 30 5 45 60 60 20 10 60 30 20 45 15 25 15 60 30 10 60 15 40 60 45 45 15 30 30 80 25 20 30 15 30 a. [2 points] Are the data discrete or continuous? How do you know? b. [4 points] Construct a dot-plot graph for the commuting times of the 40 individuals from Los Angeles. Explain how this visual representation helps in understanding the distribution of b. [4 points] Construct a dot-plot graph for the commuting times of the 40 individuals from Los Angeles. Explain how this visual representation helps in understanding the distribution of commuting times. Paste the dot-plot graph here. I recommend using Stapplet. c. [3 points] Identify the mean, median, and sample standard deviation for Los Angeles commuting times. Round to one decimal place, and use a proper statistical notation. d. [10 points] Create box plots for the commuting times in Los Angeles and New York, using the same scale for both. Use the 5-number summary to describe the spread of commuting times in each city. Look for any similarities or differences between the two cities. Based on your box plots and the spread of data, discuss which city has higher commuting times and how this information could be important for making decisions about city planning and transportation. List the 5-number summary for each data, and label the boxplots correctly. Note: Use this website for the boxplots. Round your data to the nearest integer.
Expert Answer:

Posted Date:
Students also viewed these mathematics questions
-
Evaluate and simplify the following derivatives. d (4u + u du 8u+ 1/
-
Conundrum, Inc. manufactures puzzles. Due to a fire in the administrative offices, the accounting records for September of the current year were partially destroyed. You have been able to piece...
-
A company issued bonds during the year. Would this be reported as a source or use of cash on the statement of cash flows? In which section would it be reported?
-
PlasticTech, Inc. completed the following transactions during the current year. Instructions: Journalize the transactions. Use page 8 of a general journal and page 21 of a cash payments journal....
-
The scenario: At the start of the year beginning January 1, 2013, Coco Citys General Fund had a cash balance of $ 40,000, vouchers payable of $ 35,000, and unassigned fund balance of $ 5,000. There...
-
The program should be written in MIPS. Develop a Make-Change program. Accept any number from 1 to 99 cents and determine the least number of coins (quarter, dime, nickel, and pennies) which can be...
-
pH 7 7 7 7 7 7 7777 7 NAZN 7 7 7 7 7 7 7 7 7 6.5 6.5 6.5 6.5 6.5 6.5 6.5 6.5 6.5 6.5 6.5 6.5 6.5 6.5 6.5 6.5 6.5 6.5 6.5 6.5 Day 1 M 1 F 1222 Gender 2 M 2 F 3 M 3 F 4 M 4 F 5 M 5 F 6 M 6 F 7 M 7 F 8...
-
Explain the relationship of (1) emotional feelings and (2) commitment in a persons emotional response.
-
What does it mean to have an emotional understanding of other people?
-
What would be the appropriate operating system architecture for the: (a) Inertial measurement system (b) Nuclear monitoring system (c) Patient monitoring system (d) Airline reservations system (e)...
-
What functions are performed in effective groups? Illustrate how a breakdown in one of these functions can jeopardize the success of the other functions. As your example for class discussion, use the...
-
Show with an example that EDF is no longer an optimal scheduling policy if preemption is not allowed.
-
A primary consideration in assigning a cost to a responsibility center is ________. A) whether the cost is fixed or variable. B) whether the cost is direct or indirect. C) who can best control the...
-
A police officer pulls you over and asks to search your vehicle because he suspects you have illegal drugs inside your car. Since he doesn't have reasonable suspicion to search your car, legally he...

Study smarter with the SolutionInn App