

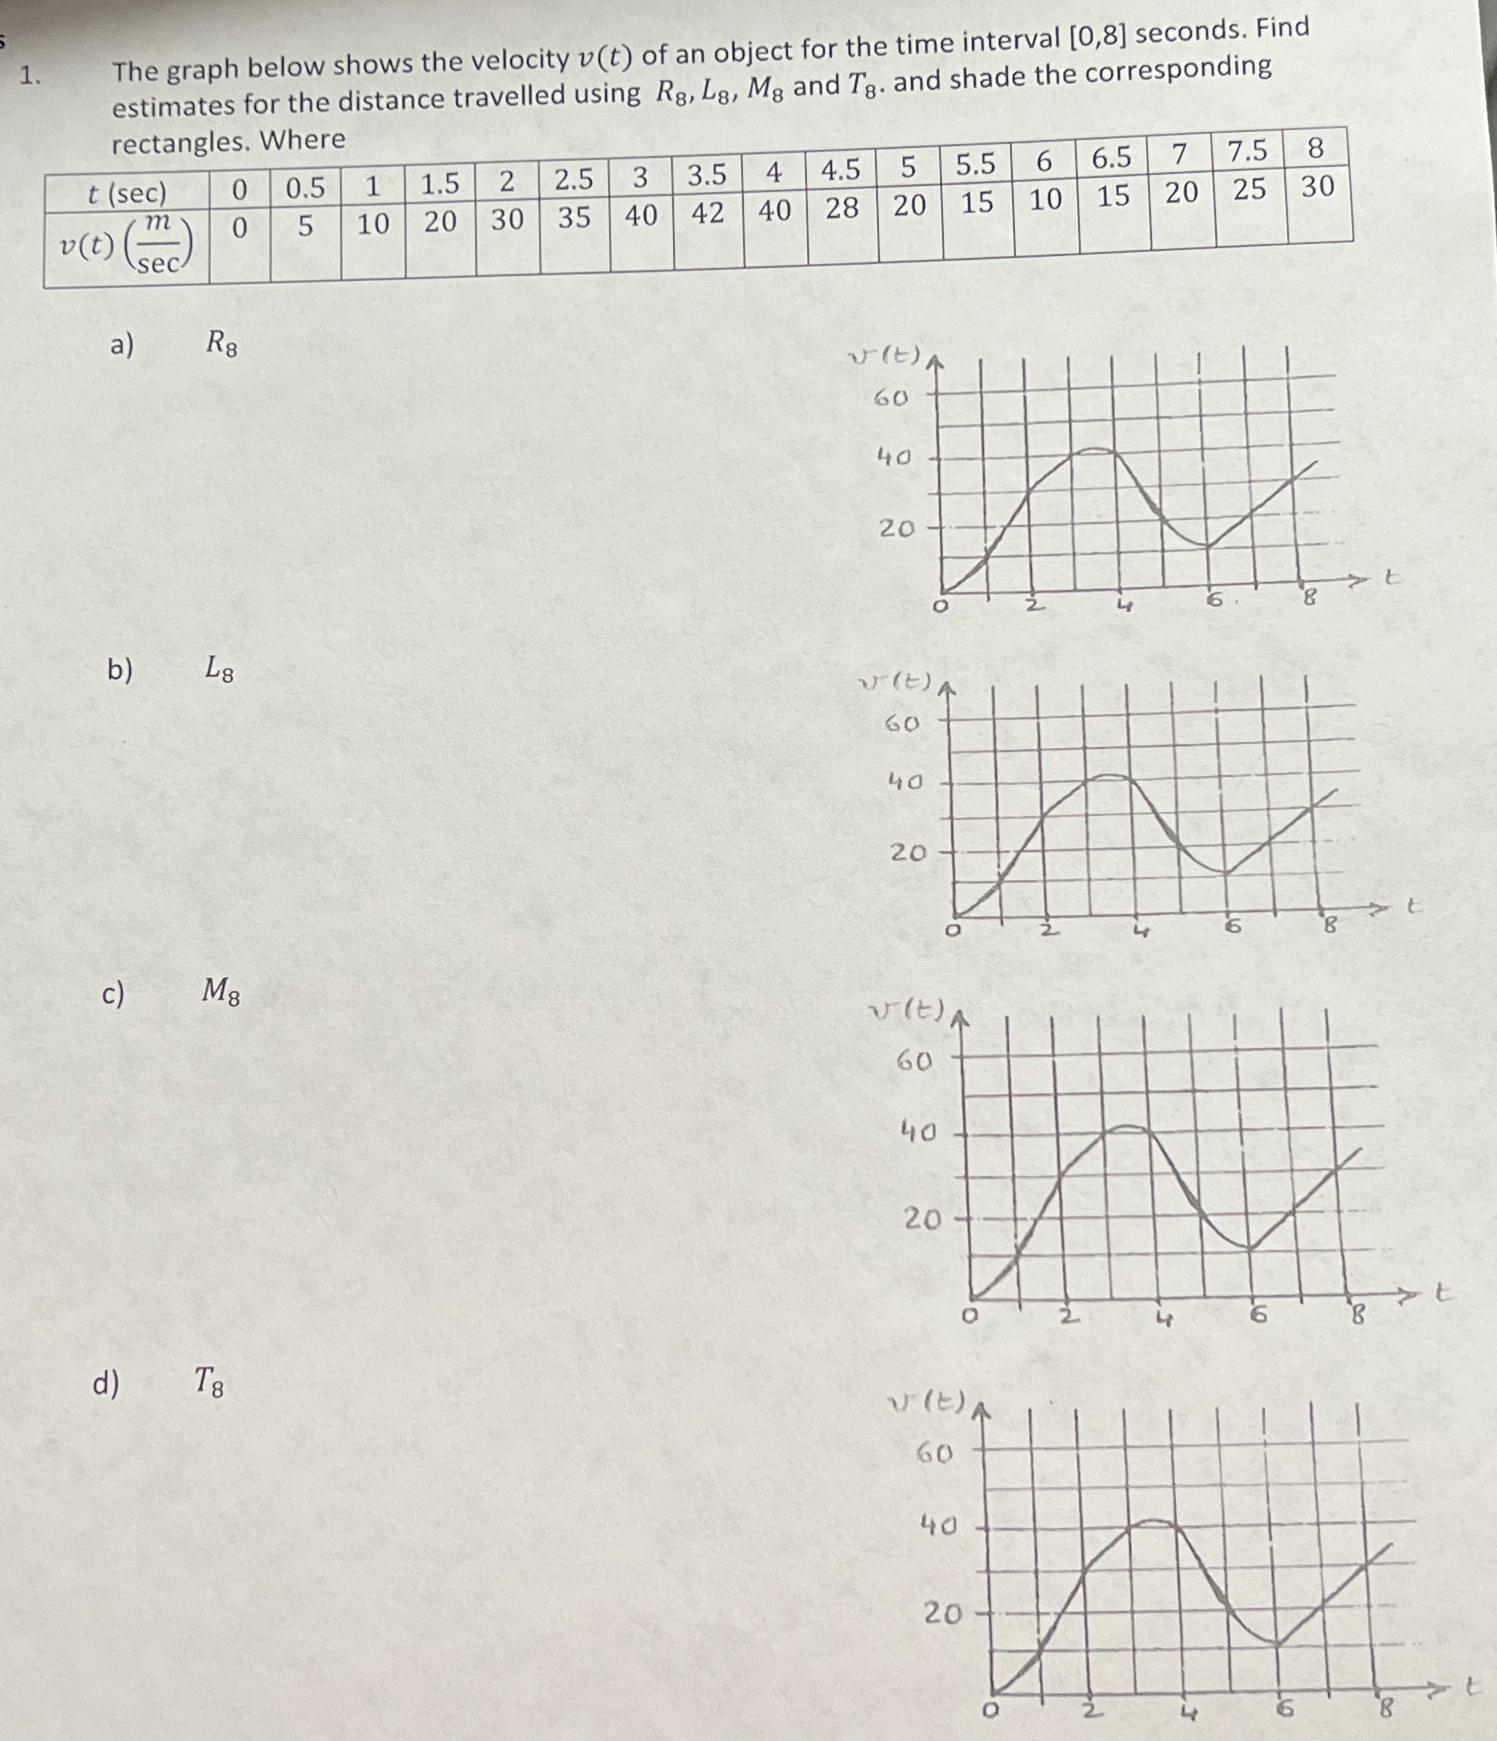
1. The graph below shows the velocity v(t) of an object for the time interval [0,8]...
Fantastic news! We've Found the answer you've been seeking!
Question:
Expert Answer:
The given problem is asking you to find estimates for the distance traveled by an object over the time interval 0 8 seconds using different methods of ... View the full answer

Related Book For 

Introduction To Statistical Investigations
ISBN: 9781118172148
1st Edition
Authors: Beth L.Chance, George W.Cobb, Allan J.Rossman Nathan Tintle, Todd Swanson Soma Roy
Posted Date:
