

1. The maximum total profit available to retailers for each province, using the 2019 self-reported usage...
Fantastic news! We've Found the answer you've been seeking!
Question:
Transcribed Image Text:
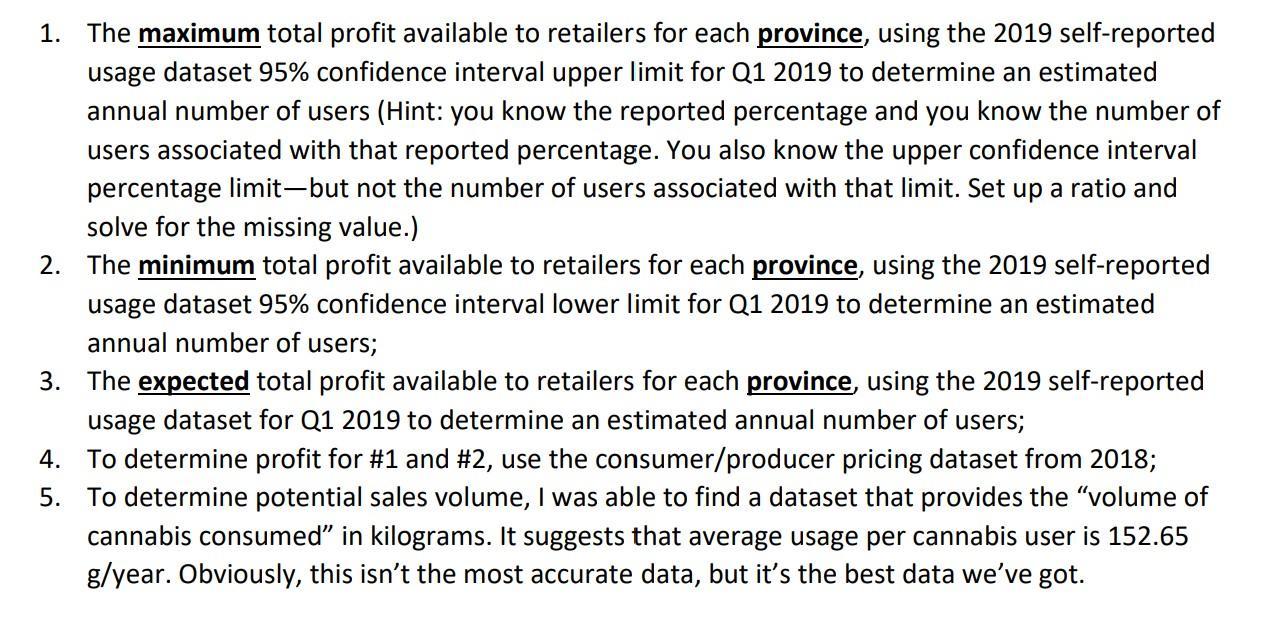
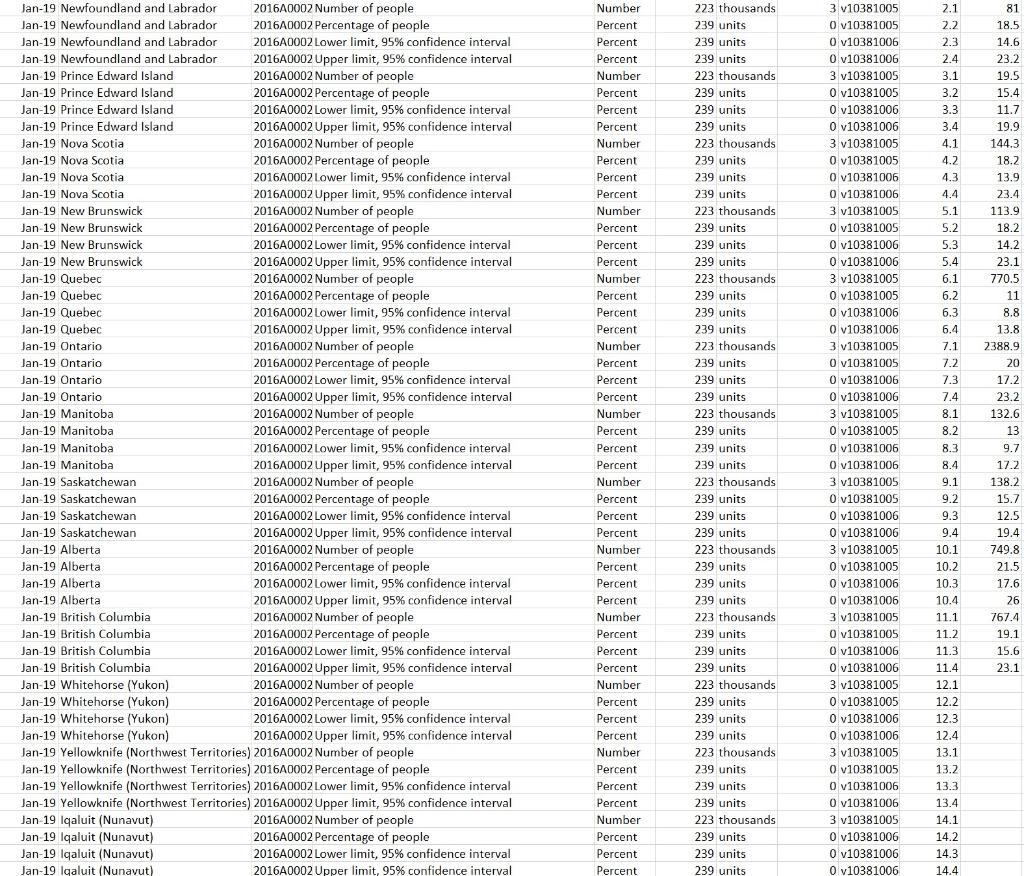
1. The maximum total profit available to retailers for each province, using the 2019 self-reported usage dataset 95% confidence interval upper limit for Q1 2019 to determine an estimated annual number of users (Hint: you know the reported percentage and you know the number of users associated with that reported percentage. You also know the upper confidence interval percentage limit-but not the number of users associated with that limit. Set up a ratio and solve for the missing value.) 2. The minimum total profit available to retailers for each province, using the 2019 self-reported usage dataset 95% confidence interval lower limit for Q1 2019 to determine an estimated annual number of users; 3. The expected total profit available to retailers for each province, using the 2019 self-reported usage dataset for Q1 2019 to determine an estimated annual number of users; 4. To determine profit for #1 and #2, use the consumer/producer pricing dataset from 2018; 5. To determine potential sales volume, I was able to find a dataset that provides the "volume of cannabis consumed" in kilograms. It suggests that average usage per cannabis user is 152.65 g/year. Obviously, this isn't the most accurate data, but it's the best data we've got. Jan-19 Newfoundland and Labrador Jan-19 Newfoundland and Labrador Jan-19 Newfoundland and Labrador Jan-19 Newfoundland and Labrador Jan 19 Prince Edward Island Jan-19 Prince Edward Island Jan-19 Prince Edward Island Jan-19 Prince Edward Island Jan-19 Nova Scotia Jan-19 Nova Scotia Jan-19 Nova Scotia Jan-19 Nova Scotia Jan-19 New Brunswick Jan 19 New Brunswick Jan 19 New Brunswick Jan-19 New Brunswick Jan-19 Quebec Jan-19 Quebec Jan-19 Quebec Jan-19 Quebec Jan-19 Ontario Jan-19 Ontario 2016A0002 Number of people 2016A0002 Percentage of people 2016A0002 Lower limit, 95% confidence interval 2016A0002 Upper limit, 95% confidence interval 2016A0002 Number of people 2016A0002 Percentage of people 2016A0002 Lower limit, 95% confidence interval 2016A0002 Upper limit, 95% confidence interval 2016A0002 Number of people 2016A0002 Percentage of people 2016A0002 Lower limit, 95% confidence interval 2016A0002 Upper limit, 95% confidence interval 2016A0002 Number of people 2016A0002 Percentage of people 2016A0002 Lower limit, 95% confidence interval 2016A0002 Upper limit, 95% confidence interval 2016A0002 Number of people 2016A0002 Percentage of people 2016A0002 Lower limit, 95% confidence interval 2016A0002 Upper limit, 95% confidence interval 2016A0002 Number of people 2016A0002 Percentage of people 2016A0002 Lower limit, 95% confidence interval 2016A0002 Upper limit, 95% confidence interval 2016A0002 Number of people 2016A0002 Percentage of people Jan-19 Ontario Jan 19 Ontario Jan 19 Manitoba Jan-19 Manitoba Jan-19 Manitoba Jan-19 Manitoba Jan-19 Saskatchewan Jan 19 Saskatchewan Jan 19 Saskatchewan Jan-19 Saskatchewan Jan-19 Alberta Jan-19 Albertal Jan-19 Alberta Jan-19 Albertal 2016A0002 Percentage of people 2016A0002 Lower limit, 95% confidence interval 2016A0002 Upper limit, 95% confidence interval 2016A0002 Number of people 2016A0002 Percentage of people Jan-19 British Columbia Jan-19 British Columbia. Jan-19 British Columbia Jan 19 British Columbia Jan-19 Whitehorse (Yukon) Jan-19 Whitehorse (Yukon) Jan-19 Whitehorse (Yukon) 2016A0002 Lower limit, 95% confidence interval Jan-19 Whitehorse (Yukon) 2016A0002 Upper limit, 95% confidence interval Jan-19 Yellowknife (Northwest Territories) 2016A0002 Number of people Jan-19 Yellowknife (Northwest Territories) 2016A0002 Percentage of people Jan-19 Yellowknife (Northwest Territories) 2016A0002 Lower limit, 95% confidence interval Jan-19 Yellowknife (Northwest Territories) 2016A0002 Upper limit, 95% confidence interval Jan 19 Iqaluit (Nunavut) 2016A0002 Number of people Jan 19 Iqaluit (Nunavut) 2016A0002 Percentage of people Jan-19 Iqaluit (Nunavut) Jan-19 Iqaluit (Nunavut) 2016A0002 Lower limit, 95% confidence interval 2016A0002 Upper limit, 95% confidence interval 2016A0002 Lower limit, 95% confidence interval 2016A0002 Upper limit, 95% confidence interval 2016A0002 Number of people 2016A0002 Percentage of people 2016A0002 Lower limit, 95% confidence interval 2016A0002 Upper limit, 95% confidence interval 2016A0002 Number of people 2016A0002 Percentage of people 2016A0002 Lower limit, 95% confidence interval 2016A0002 Upper limit, 95% confidence interval 2016A0002 Number of people Number Percent Percent Percent Number Percent Percent Percent Number Percent Percent Percent Number Percent Percent Percent Number Percent Percent Percent Number Percent Percent Percent Number Percent Percent Percent Number Percent Percent Percent Number Percent Percent Percent Number Percent Percent Percent Number Percent. Percent Percent Number Percent Percent Percent Number Percent Percent Percent 223 thousands 239 units 239 units 239 units 223 thousands 239 units 239 units 239 units 223 thousands 239 units. 239 units 239 units 223 thousands 239 units 239 units 239 units 223 thousands 239 units 239 units. 239 units 223 thousands 239 units 239 units 239 units 223 thousands 239 units 239 units 239 units 223 thousands 239 units. 239 units 239 units 223 thousands 239 units 239 units 239 units. 223 thousands 239 units 239 units 239 units 223 thousands 239 units 239 units. 239 units. 223 thousands 239 units 239 units 239 units 223 thousands 239 units 239 units 239 units 3 v10381005 v10381005 0 0 v10381006 0 v10381006 3 v10381005 0 v10381005 0 v10381006 0 v10381006 3 v10381005 0 v10381005 0 v10381006 0 v10381006 3 v10381005 0 v10381005 0 v10381006 0 v10381006 3 v10381005 0 v10381005 0 v10381006 0 v10381006 3 v10381005 0 v10381005 0 v10381006 0 v10381006 3 v10381005 0 v10381005 0 v10381006 0 v10381006 3 v10381005 0 v10381005 0 v10381006 0 v10381006 3 v10381005 0 v10381005 0 v10381006 0 v10381006 3 v10381005 0 v10381005 0 v10381006 0 v10381006 3 v10381005 0 v10381005 0 v10381006 0 v10381006 3 v10381005 0 v10381005 0 v10381006 0 v10381006 3 v10381005 0 v10381006 0 v10381006 0 v10381006 2.1 2.2 2.3 2.4 3.1 3.2 3.3 3.4 4.1 4.2 4.3 4.4 5.1 5.2 5.3 5.4 6.1 6.2 6.3 6.4 7.1 7.2 7.3 7.4 8.1 8.2 8.3 8.4 9.1 9.2 9.3 9.4 10.1 10.2 10.3 10.4 11.1 11.2 11.3 11.4 12.1 12.2 12.3 12.4 13.1 13.2 13.3. 13.4 14.1 14.2 14.3 14.4 81 18.5 14.6 23.2 19.5 15.4 11.7 19.9 144.3 18.2 13.9 23.4 113.9 18.2 14.2 23.1 770.5 11 8.8 13.8 2388.9 20 17.2 23.2 132.6 13 9.7 17.2 138.2 15.7 12.5 19.4 749.8 21.5 17.6 26 767.4 19.1 15.6 23.1 1. The maximum total profit available to retailers for each province, using the 2019 self-reported usage dataset 95% confidence interval upper limit for Q1 2019 to determine an estimated annual number of users (Hint: you know the reported percentage and you know the number of users associated with that reported percentage. You also know the upper confidence interval percentage limit-but not the number of users associated with that limit. Set up a ratio and solve for the missing value.) 2. The minimum total profit available to retailers for each province, using the 2019 self-reported usage dataset 95% confidence interval lower limit for Q1 2019 to determine an estimated annual number of users; 3. The expected total profit available to retailers for each province, using the 2019 self-reported usage dataset for Q1 2019 to determine an estimated annual number of users; 4. To determine profit for #1 and #2, use the consumer/producer pricing dataset from 2018; 5. To determine potential sales volume, I was able to find a dataset that provides the "volume of cannabis consumed" in kilograms. It suggests that average usage per cannabis user is 152.65 g/year. Obviously, this isn't the most accurate data, but it's the best data we've got. Jan-19 Newfoundland and Labrador Jan-19 Newfoundland and Labrador Jan-19 Newfoundland and Labrador Jan-19 Newfoundland and Labrador Jan 19 Prince Edward Island Jan-19 Prince Edward Island Jan-19 Prince Edward Island Jan-19 Prince Edward Island Jan-19 Nova Scotia Jan-19 Nova Scotia Jan-19 Nova Scotia Jan-19 Nova Scotia Jan-19 New Brunswick Jan 19 New Brunswick Jan 19 New Brunswick Jan-19 New Brunswick Jan-19 Quebec Jan-19 Quebec Jan-19 Quebec Jan-19 Quebec Jan-19 Ontario Jan-19 Ontario 2016A0002 Number of people 2016A0002 Percentage of people 2016A0002 Lower limit, 95% confidence interval 2016A0002 Upper limit, 95% confidence interval 2016A0002 Number of people 2016A0002 Percentage of people 2016A0002 Lower limit, 95% confidence interval 2016A0002 Upper limit, 95% confidence interval 2016A0002 Number of people 2016A0002 Percentage of people 2016A0002 Lower limit, 95% confidence interval 2016A0002 Upper limit, 95% confidence interval 2016A0002 Number of people 2016A0002 Percentage of people 2016A0002 Lower limit, 95% confidence interval 2016A0002 Upper limit, 95% confidence interval 2016A0002 Number of people 2016A0002 Percentage of people 2016A0002 Lower limit, 95% confidence interval 2016A0002 Upper limit, 95% confidence interval 2016A0002 Number of people 2016A0002 Percentage of people 2016A0002 Lower limit, 95% confidence interval 2016A0002 Upper limit, 95% confidence interval 2016A0002 Number of people 2016A0002 Percentage of people Jan-19 Ontario Jan 19 Ontario Jan 19 Manitoba Jan-19 Manitoba Jan-19 Manitoba Jan-19 Manitoba Jan-19 Saskatchewan Jan 19 Saskatchewan Jan 19 Saskatchewan Jan-19 Saskatchewan Jan-19 Alberta Jan-19 Albertal Jan-19 Alberta Jan-19 Albertal 2016A0002 Percentage of people 2016A0002 Lower limit, 95% confidence interval 2016A0002 Upper limit, 95% confidence interval 2016A0002 Number of people 2016A0002 Percentage of people Jan-19 British Columbia Jan-19 British Columbia. Jan-19 British Columbia Jan 19 British Columbia Jan-19 Whitehorse (Yukon) Jan-19 Whitehorse (Yukon) Jan-19 Whitehorse (Yukon) 2016A0002 Lower limit, 95% confidence interval Jan-19 Whitehorse (Yukon) 2016A0002 Upper limit, 95% confidence interval Jan-19 Yellowknife (Northwest Territories) 2016A0002 Number of people Jan-19 Yellowknife (Northwest Territories) 2016A0002 Percentage of people Jan-19 Yellowknife (Northwest Territories) 2016A0002 Lower limit, 95% confidence interval Jan-19 Yellowknife (Northwest Territories) 2016A0002 Upper limit, 95% confidence interval Jan 19 Iqaluit (Nunavut) 2016A0002 Number of people Jan 19 Iqaluit (Nunavut) 2016A0002 Percentage of people Jan-19 Iqaluit (Nunavut) Jan-19 Iqaluit (Nunavut) 2016A0002 Lower limit, 95% confidence interval 2016A0002 Upper limit, 95% confidence interval 2016A0002 Lower limit, 95% confidence interval 2016A0002 Upper limit, 95% confidence interval 2016A0002 Number of people 2016A0002 Percentage of people 2016A0002 Lower limit, 95% confidence interval 2016A0002 Upper limit, 95% confidence interval 2016A0002 Number of people 2016A0002 Percentage of people 2016A0002 Lower limit, 95% confidence interval 2016A0002 Upper limit, 95% confidence interval 2016A0002 Number of people Number Percent Percent Percent Number Percent Percent Percent Number Percent Percent Percent Number Percent Percent Percent Number Percent Percent Percent Number Percent Percent Percent Number Percent Percent Percent Number Percent Percent Percent Number Percent Percent Percent Number Percent Percent Percent Number Percent. Percent Percent Number Percent Percent Percent Number Percent Percent Percent 223 thousands 239 units 239 units 239 units 223 thousands 239 units 239 units 239 units 223 thousands 239 units. 239 units 239 units 223 thousands 239 units 239 units 239 units 223 thousands 239 units 239 units. 239 units 223 thousands 239 units 239 units 239 units 223 thousands 239 units 239 units 239 units 223 thousands 239 units. 239 units 239 units 223 thousands 239 units 239 units 239 units. 223 thousands 239 units 239 units 239 units 223 thousands 239 units 239 units. 239 units. 223 thousands 239 units 239 units 239 units 223 thousands 239 units 239 units 239 units 3 v10381005 v10381005 0 0 v10381006 0 v10381006 3 v10381005 0 v10381005 0 v10381006 0 v10381006 3 v10381005 0 v10381005 0 v10381006 0 v10381006 3 v10381005 0 v10381005 0 v10381006 0 v10381006 3 v10381005 0 v10381005 0 v10381006 0 v10381006 3 v10381005 0 v10381005 0 v10381006 0 v10381006 3 v10381005 0 v10381005 0 v10381006 0 v10381006 3 v10381005 0 v10381005 0 v10381006 0 v10381006 3 v10381005 0 v10381005 0 v10381006 0 v10381006 3 v10381005 0 v10381005 0 v10381006 0 v10381006 3 v10381005 0 v10381005 0 v10381006 0 v10381006 3 v10381005 0 v10381005 0 v10381006 0 v10381006 3 v10381005 0 v10381006 0 v10381006 0 v10381006 2.1 2.2 2.3 2.4 3.1 3.2 3.3 3.4 4.1 4.2 4.3 4.4 5.1 5.2 5.3 5.4 6.1 6.2 6.3 6.4 7.1 7.2 7.3 7.4 8.1 8.2 8.3 8.4 9.1 9.2 9.3 9.4 10.1 10.2 10.3 10.4 11.1 11.2 11.3 11.4 12.1 12.2 12.3 12.4 13.1 13.2 13.3. 13.4 14.1 14.2 14.3 14.4 81 18.5 14.6 23.2 19.5 15.4 11.7 19.9 144.3 18.2 13.9 23.4 113.9 18.2 14.2 23.1 770.5 11 8.8 13.8 2388.9 20 17.2 23.2 132.6 13 9.7 17.2 138.2 15.7 12.5 19.4 749.8 21.5 17.6 26 767.4 19.1 15.6 23.1
Expert Answer:
Answer rating: 100% (QA)
1 The maximum total profit available to retailers for each province using the 2019 selfreported usage dataset 95 confidence interval upper limit for Q1 2019 to determine an estimated annual number of ... View the full answer

Related Book For 

Posted Date:
Students also viewed these law questions
-
Set up a ratio for each of the following and reduce to lowest terms. (a) 12 dimes to 5 quarters (b) 15 hours to 3 days (c) 6 seconds for 50 meters (d) $72 per dozen (e) $40 per day for 12 employees...
-
Set up a ratio problem. If the ratio cannot be reduced to an equivalent ratio in terms of small integers, then express it as a ratio of decimal equivalents with the smallest term set at 1. Maintain...
-
Set up a ratio problem. If the ratio cannot be reduced to an equivalent ratio in terms of small integers, then express it as a ratio of decimal equivalents with the smallest term set at 1. Maintain...
-
An increase in investment increases consumption in the short run, has no effect on consumption in the long run, and has an ambiguous effect on consumption in the Solow model of the very long run,...
-
A casino game involves rolling three dice. The winning are directly proportional to the total number of sixes rolled. Suppose a gambler plays the game 150 times, with the following observed counts:...
-
Your financial planner offers you two different investment plans. Plan X is a $15,000 annual perpetuity. Plan Y is a 10-year, $31,000 annual annuity. Both plans will make their first payment one year...
-
Radiocarbon dating assumes that the abundance of \({ }^{14} \mathrm{C}\) in the environment has been constant. Suppose \({ }^{14} \mathrm{C}\) was less abundant 10,000 years ago than it is today....
-
Arness Woodcrafters sells $250,000 of receivables to Commercial Factors, Inc. on a with recourse basis. Commercial assesses a finance charge of 5% and retains an amount equal to 4% of accounts...
-
Two of the factors that influence project plans include: Learning Curve and Organizational Project Management Maturity. The Learning Curve theory is a concept that discusses how organizational and...
-
The following selected transactions relate to investment activities of Ornamental Insulation Corporation during 2024. The company buys debt securities, not intending to profit from short-term...
-
Critically evaluate the adaptive and innate immune responses in the context of pathogen recognition, detailing the molecular mechanisms that underlie host defense strategies, immune memory formation,...
-
Find an organization in your city, and analyze how its technology works. Use the concepts discussed in this chapter: technical complexity, nonroutine tasks, and task interdependence.
-
What is the relationship among creativity, intrapreneurship, and innovation?
-
How do cognitive biases affect organizational learning and the quality of decision making? What can be done to reduce their negative impact?
-
In the early 2000s, Walt Disney CEO Michael Eisner came under increasing criticism for the companys falling performance and for the way that he had centralized decision making so that all important...
-
Why and under what conditions can conflict be good or bad for an organization? Would you expect a higher level of conflict in a mechanistic or an organic structure? Why?
-
Creating a Persuasive Outline (not graded) Select one of the topics on the next slide, and brainstorm ideas for each section of the following outline. After you've mapped out your best ideas for the...
-
If your school has a subscription to the FASB Codification, go to aaahq.org/ ascLogin.cfm to log in and prepare responses to the following. (a) What is the stock dividend? (b) What is a stock split?...
-
Between 2.11 and 4.00 Assume that a randomly selected subject is given a bone density test. Those test scores are normally distributed with a mean of 0 and a standard deviation of 1. In each case,...
-
In the same competition described in Exercise 9, a third judge ranked the bands with the results shown below. Test for a correlation between the first and third judges. Do the judges appear to rank...
-
The last 106 baseball seasons ended with 62 World Series wins by American League teams and 44 wins by National League teams. Can the runs test be used to show that the American League is better...
-
Wagons and Wheels Ltd is a farm machinery dealership. In recent years, the company has experienced unsatisfactory profit results because of declining sales in the area. At the suggestion of the...
-
Quick Brekkie Ltd is evaluating three comparable investments. Summary data for the three investments, each of which would be paid for in current dollars, are listed below. Required Rank the three...
-
Phone Screens and Computer Screens are two divisions operated as investment centres of Siciliano Ltd. Management wants to know which of the two earned the highest return on investment for the year...

Study smarter with the SolutionInn App