

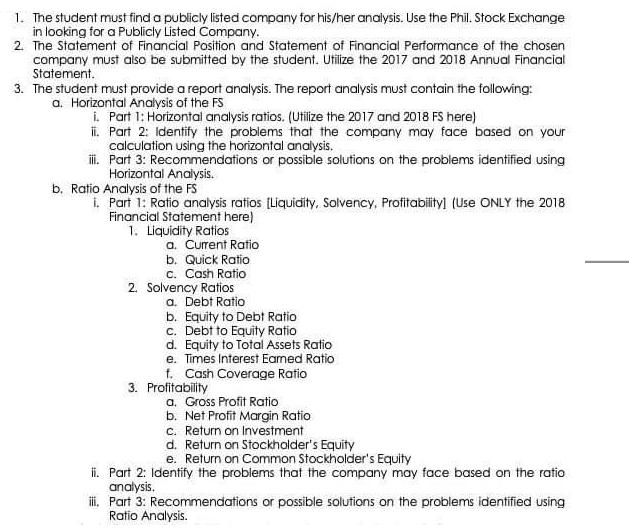
1. The student must find a publicly listed company for his/her analysis. Use the Phil. Stock...
Fantastic news! We've Found the answer you've been seeking!
Question:
Transcribed Image Text:
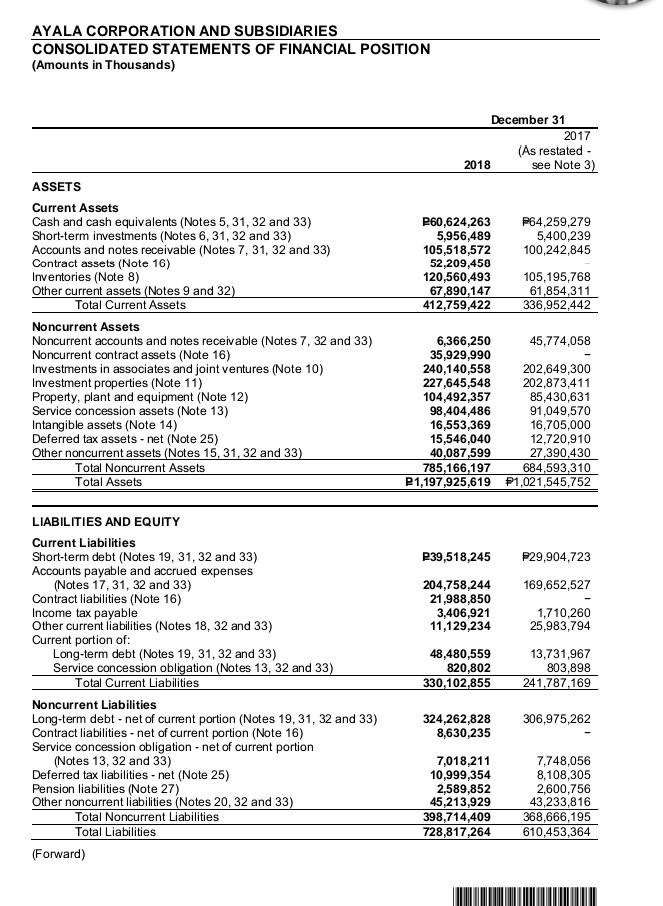
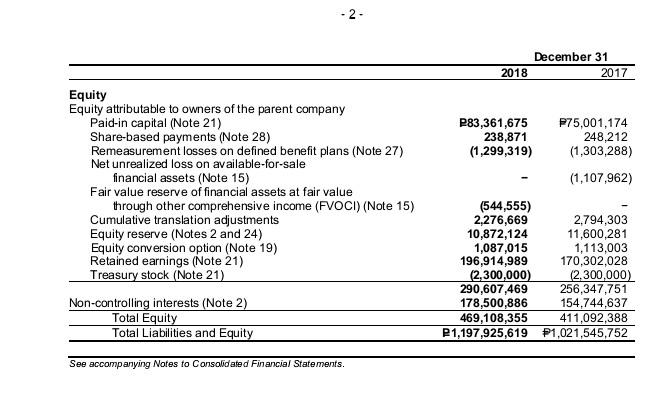
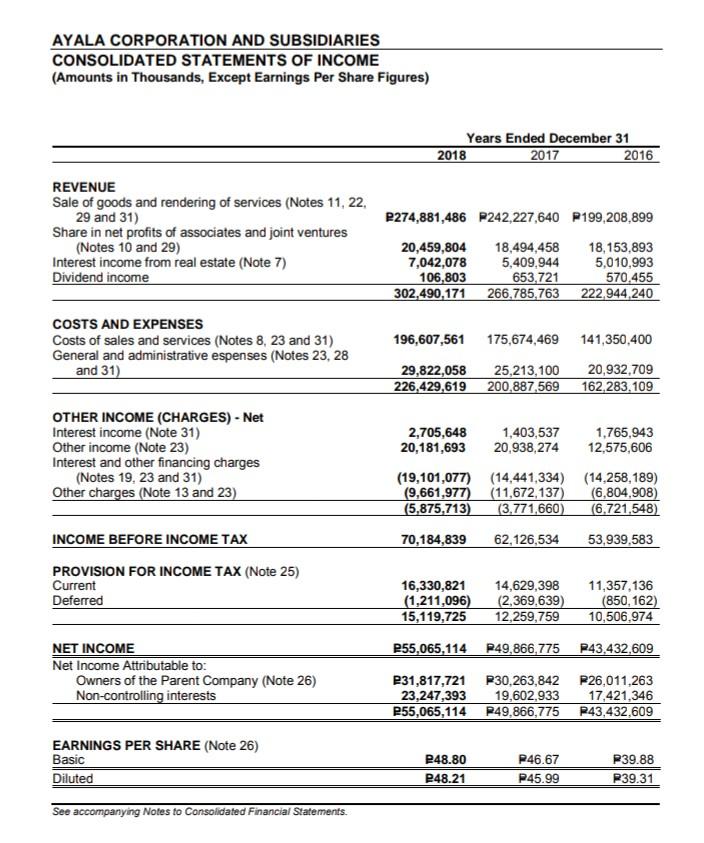
1. The student must find a publicly listed company for his/her analysis. Use the Phil. Stock Exchange in looking for a Publicly Listed Company. 2. The Statement of Financial Position and Statement of Financial Performance of the chosen company must also be submitted by the student. Utilize the 2017 and 2018 Annual Financial Statement. 3. The student must provide a report analysis. The report analysis must contain the following: a. Horizontal Analysis of the FS i. Part 1: Horizontal analysis ratios. (Utilize the 2017 and 2018 FS here) i Part 2: Identify the problems that the company may face based on your calculation using the horizontal analysis. ili. Part 3: Recommendations or possible solutions on the problems identified using Horizontal Analysis. b. Ratio Analysis of the FS i. Part 1: Ratio analysis ratios [Liquidity, Solvency, Profitability] (Use ONLY the 2018 Financial Statement here) 1. Liquidity Ratios a. Current Ratio b. Quick Ratio c. Cash Ratio 2. Solvency Ratios a. Debt Ratio b. Equity to Debt Ratio c. Debt to Equity Ratio d. Equity to Total Assets Ratio e. Times Interest Eamed Ratio f. Cash Coverage Ratio 3. Profitability a. Gross Profit Ratio b. Net Profit Margin Ratio c. Return on Investment d. Return on Stockholder's Equity e. Return on Common Stockholder's Equity ii. Part 2: Identify the problems that the company may face based on the ratio analysis. iii. Part 3: Recommendations or possible solutions on the problems identified using Ratio Analysis. AYALA CORPORATION AND SUBSIDIARIES CONSOLIDATED STATEMENTS OF FINANCIAL POSITION (Amounts in Thousands) ASSETS Current Assets Cash and cash equivalents (Notes 5, 31, 32 and 33) Short-term investments (Notes 6, 31, 32 and 33) Accounts and notes receivable (Notes 7, 31, 32 and 33) Contract assets (Note 16) Inventories (Note 8) Other current assets (Notes 9 and 32) Total Current Assets Noncurrent Assets Noncurrent accounts and notes receivable (Notes 7, 32 and 33) Noncurrent contract assets (Note 16) Investments in associates and joint ventures (Note 10) Investment properties (Note 11) Property, plant and equipment (Note 12) Service concession assets (Note 13) Intangible assets (Note 14) Deferred tax assets-net (Note 25) Other noncurrent assets (Notes 15, 31, 32 and 33) Total Noncurrent Assets Total Assets LIABILITIES AND EQUITY Current Liabilities Short-term debt (Notes 19, 31, 32 and 33) Accounts payable and accrued expenses (Notes 17, 31, 32 and 33) Contract liabilities (Note 16) Income tax payable Other current liabilities (Notes 18, 32 and 33) Current portion of: Long-term debt (Notes 19, 31, 32 and 33) Service concession obligation (Notes 13, 32 and 33) Total Current Liabilities Noncurrent Liabilities Long-term debt - net of current portion (Notes 19, 31, 32 and 33) Contract liabilities - net of current portion (Note 16) Service concession obligation - net of current portion (Notes 13, 32 and 33) Deferred tax liabilities-net (Note 25) Pension liabilities (Note 27) Other noncurrent liabilities (Notes 20, 32 and 33) Total Noncurrent Liabilities Total Liabilities (Forward) 2018 December 31 P60,624,263 5,956,489 105,518,572 52,209,450 120,560,493 105,195,768 67,890,147 61,854,311 412,759,422 336,952,442 6,366,250 45,774,058 35,929,990 240,140,558 202,649,300 227,645,548 202,873,411 104,492,357 85,430,631 91,049,570 16,705,000 12,720,910 27,390,430 684,593,310 48,480,559 820,802 330,102,855 98,404,486 16,553,369 15,546,040 40,087,599 785,166,197 P1,197,925,619 P1,021,545,752 2017 (As restated - see Note 3) P39,518,245 P29,904,723 204,758,244 169,652,527 21,988,850 3,406,921 11,129,234 324,262,828 8,630,235 7,018,211 10,999,354 P64,259,279 5,400,239 100,242,845 2,589,852 45,213,929 398,714,409 728,817,264 1,710,260 25,983,794 13,731,967 803,898 241,787,169 306,975,262 7,748,056 8,108,305 2,600,756 43,233,816 368,666,195 610,453,364 - 2- Equity Equity attributable to owners of the parent company Paid-in capital (Note 21) Share-based payments (Note 28) Remeasurement losses on defined benefit plans (Note 27) Net unrealized loss on available-for-sale financial assets (Note 15) Fair value reserve of financial assets at fair value through other comprehensive income (FVOCI) (Note 15) Cumulative translation adjustments Equity reserve (Notes 2 and 24) Equity conversion option (Note 19) Retained earnings (Note 21) Treasury stock (Note 21) Non-controlling interests (Note 2) Total Equity Total Liabilities and Equity See accompanying Notes to Consolidated Financial Statements. 2018 December 31 2017 P83,361,675 P75,001,174 238,871 (1,299,319) (544,555) 2,276,669 10,872,124 1,087,015 196,914,989 248,212 (1,303,288) (1,107,962) 2,794,303 11,600,281 1,113,003 170,302,028 (2,300,000) (2,300,000) 290,607,469 256,347,751 178,500,886 154,744,637 469,108,355 411,092,388 P1,197,925,619 P1,021,545,752 AYALA CORPORATION AND SUBSIDIARIES CONSOLIDATED STATEMENTS OF INCOME (Amounts in Thousands, Except Earnings Per Share Figures) REVENUE Sale of goods and rendering of services (Notes 11, 22, 29 and 31) Share in net profits of associates and joint ventures (Notes 10 and 29) Interest income from real estate (Note 7) Dividend income COSTS AND EXPENSES Costs of sales and services (Notes 8, 23 and 31) General and administrative espenses (Notes 23, 28 and 31) OTHER INCOME (CHARGES) - Net Interest income (Note 31) Other income (Note 23) Interest and other financing charges (Notes 19, 23 and 31) Other charges (Note 13 and 23) INCOME BEFORE INCOME TAX PROVISION FOR INCOME TAX (Note 25) Current Deferred NET INCOME Net Income Attributable to: Owners of the Parent Company (Note 26) Non-controlling interests EARNINGS PER SHARE (Note 26) Basic Diluted See accompanying Notes to Consolidated Financial Statements. Years Ended December 31 2017 2018 P274,881,486 P242,227,640 P199,208,899 20,459,804 18,494,458 18,153,893 7,042,078 5,409,944 5,010,993 106,803 653,721 570,455 302,490,171 266,785,763 222,944,240 2016 196,607,561 175,674,469 141,350,400 20,932,709 29,822,058 25,213,100 226,429,619 200,887,569 162,283,109 2,705,648 1,403,537 1,765,943 20,181,693 20,938,274 12,575,606 (19,101,077) (14,441,334) (14,258,189) (9,661,977) (11,672,137) (6,804,908) (5,875,713) (3,771,660) (6,721,548) 70,184,839 62,126,534 53,939,583 16,330,821 14,629,398 11,357,136 (1,211,096) (2,369,639) (850, 162) 15,119,725 12,259,759 10,506,974 P55,065,114 P49,866,775 P43,432,609 P31,817,721 P30,263,842 P26,011,263 23,247,393 19,602,933 17,421,346 P55,065,114 P49,866,775 P43,432,609 P48.80 P48.21 P46.67 P45.99 P39.88 P39.31 1. The student must find a publicly listed company for his/her analysis. Use the Phil. Stock Exchange in looking for a Publicly Listed Company. 2. The Statement of Financial Position and Statement of Financial Performance of the chosen company must also be submitted by the student. Utilize the 2017 and 2018 Annual Financial Statement. 3. The student must provide a report analysis. The report analysis must contain the following: a. Horizontal Analysis of the FS i. Part 1: Horizontal analysis ratios. (Utilize the 2017 and 2018 FS here) i Part 2: Identify the problems that the company may face based on your calculation using the horizontal analysis. ili. Part 3: Recommendations or possible solutions on the problems identified using Horizontal Analysis. b. Ratio Analysis of the FS i. Part 1: Ratio analysis ratios [Liquidity, Solvency, Profitability] (Use ONLY the 2018 Financial Statement here) 1. Liquidity Ratios a. Current Ratio b. Quick Ratio c. Cash Ratio 2. Solvency Ratios a. Debt Ratio b. Equity to Debt Ratio c. Debt to Equity Ratio d. Equity to Total Assets Ratio e. Times Interest Eamed Ratio f. Cash Coverage Ratio 3. Profitability a. Gross Profit Ratio b. Net Profit Margin Ratio c. Return on Investment d. Return on Stockholder's Equity e. Return on Common Stockholder's Equity ii. Part 2: Identify the problems that the company may face based on the ratio analysis. iii. Part 3: Recommendations or possible solutions on the problems identified using Ratio Analysis. AYALA CORPORATION AND SUBSIDIARIES CONSOLIDATED STATEMENTS OF FINANCIAL POSITION (Amounts in Thousands) ASSETS Current Assets Cash and cash equivalents (Notes 5, 31, 32 and 33) Short-term investments (Notes 6, 31, 32 and 33) Accounts and notes receivable (Notes 7, 31, 32 and 33) Contract assets (Note 16) Inventories (Note 8) Other current assets (Notes 9 and 32) Total Current Assets Noncurrent Assets Noncurrent accounts and notes receivable (Notes 7, 32 and 33) Noncurrent contract assets (Note 16) Investments in associates and joint ventures (Note 10) Investment properties (Note 11) Property, plant and equipment (Note 12) Service concession assets (Note 13) Intangible assets (Note 14) Deferred tax assets-net (Note 25) Other noncurrent assets (Notes 15, 31, 32 and 33) Total Noncurrent Assets Total Assets LIABILITIES AND EQUITY Current Liabilities Short-term debt (Notes 19, 31, 32 and 33) Accounts payable and accrued expenses (Notes 17, 31, 32 and 33) Contract liabilities (Note 16) Income tax payable Other current liabilities (Notes 18, 32 and 33) Current portion of: Long-term debt (Notes 19, 31, 32 and 33) Service concession obligation (Notes 13, 32 and 33) Total Current Liabilities Noncurrent Liabilities Long-term debt - net of current portion (Notes 19, 31, 32 and 33) Contract liabilities - net of current portion (Note 16) Service concession obligation - net of current portion (Notes 13, 32 and 33) Deferred tax liabilities-net (Note 25) Pension liabilities (Note 27) Other noncurrent liabilities (Notes 20, 32 and 33) Total Noncurrent Liabilities Total Liabilities (Forward) 2018 December 31 P60,624,263 5,956,489 105,518,572 52,209,450 120,560,493 105,195,768 67,890,147 61,854,311 412,759,422 336,952,442 6,366,250 45,774,058 35,929,990 240,140,558 202,649,300 227,645,548 202,873,411 104,492,357 85,430,631 91,049,570 16,705,000 12,720,910 27,390,430 684,593,310 48,480,559 820,802 330,102,855 98,404,486 16,553,369 15,546,040 40,087,599 785,166,197 P1,197,925,619 P1,021,545,752 2017 (As restated - see Note 3) P39,518,245 P29,904,723 204,758,244 169,652,527 21,988,850 3,406,921 11,129,234 324,262,828 8,630,235 7,018,211 10,999,354 P64,259,279 5,400,239 100,242,845 2,589,852 45,213,929 398,714,409 728,817,264 1,710,260 25,983,794 13,731,967 803,898 241,787,169 306,975,262 7,748,056 8,108,305 2,600,756 43,233,816 368,666,195 610,453,364 - 2- Equity Equity attributable to owners of the parent company Paid-in capital (Note 21) Share-based payments (Note 28) Remeasurement losses on defined benefit plans (Note 27) Net unrealized loss on available-for-sale financial assets (Note 15) Fair value reserve of financial assets at fair value through other comprehensive income (FVOCI) (Note 15) Cumulative translation adjustments Equity reserve (Notes 2 and 24) Equity conversion option (Note 19) Retained earnings (Note 21) Treasury stock (Note 21) Non-controlling interests (Note 2) Total Equity Total Liabilities and Equity See accompanying Notes to Consolidated Financial Statements. 2018 December 31 2017 P83,361,675 P75,001,174 238,871 (1,299,319) (544,555) 2,276,669 10,872,124 1,087,015 196,914,989 248,212 (1,303,288) (1,107,962) 2,794,303 11,600,281 1,113,003 170,302,028 (2,300,000) (2,300,000) 290,607,469 256,347,751 178,500,886 154,744,637 469,108,355 411,092,388 P1,197,925,619 P1,021,545,752 AYALA CORPORATION AND SUBSIDIARIES CONSOLIDATED STATEMENTS OF INCOME (Amounts in Thousands, Except Earnings Per Share Figures) REVENUE Sale of goods and rendering of services (Notes 11, 22, 29 and 31) Share in net profits of associates and joint ventures (Notes 10 and 29) Interest income from real estate (Note 7) Dividend income COSTS AND EXPENSES Costs of sales and services (Notes 8, 23 and 31) General and administrative espenses (Notes 23, 28 and 31) OTHER INCOME (CHARGES) - Net Interest income (Note 31) Other income (Note 23) Interest and other financing charges (Notes 19, 23 and 31) Other charges (Note 13 and 23) INCOME BEFORE INCOME TAX PROVISION FOR INCOME TAX (Note 25) Current Deferred NET INCOME Net Income Attributable to: Owners of the Parent Company (Note 26) Non-controlling interests EARNINGS PER SHARE (Note 26) Basic Diluted See accompanying Notes to Consolidated Financial Statements. Years Ended December 31 2017 2018 P274,881,486 P242,227,640 P199,208,899 20,459,804 18,494,458 18,153,893 7,042,078 5,409,944 5,010,993 106,803 653,721 570,455 302,490,171 266,785,763 222,944,240 2016 196,607,561 175,674,469 141,350,400 20,932,709 29,822,058 25,213,100 226,429,619 200,887,569 162,283,109 2,705,648 1,403,537 1,765,943 20,181,693 20,938,274 12,575,606 (19,101,077) (14,441,334) (14,258,189) (9,661,977) (11,672,137) (6,804,908) (5,875,713) (3,771,660) (6,721,548) 70,184,839 62,126,534 53,939,583 16,330,821 14,629,398 11,357,136 (1,211,096) (2,369,639) (850, 162) 15,119,725 12,259,759 10,506,974 P55,065,114 P49,866,775 P43,432,609 P31,817,721 P30,263,842 P26,011,263 23,247,393 19,602,933 17,421,346 P55,065,114 P49,866,775 P43,432,609 P48.80 P48.21 P46.67 P45.99 P39.88 P39.31
Expert Answer:

Related Book For 

Income Tax Fundamentals 2013
ISBN: 9781285586618
31st Edition
Authors: Gerald E. Whittenburg, Martha Altus Buller, Steven L Gill
Posted Date:
Students also viewed these economics questions
-
BookWeb, Incorporated, sells books and software over the Internet. A recent article in a trade journal has caught the attention of management because the company has experienced soaring inventory...
-
A sustainable business and mission require effective planning and financial management. Ratio analysis is a useful management tool that will improve the understanding of financial results and trends...
-
You are a CPA student working in the accounting department of Reynolds Liquor Distributors Ltd. (RLDL) for the year ended December 31, 2019. Your role requires you to prepare and analyze the annual...
-
In Power Bi please:I have a data table in the following format:DateSoccerBasketballBaseball2022 November9856602022 December10154612023 January10457642023 February100506 1 answer
-
A completed worksheet for Cedar Valley Nursery and Landscape is shown below. INSTRUCTIONS 1. Record the balances as of December 31 in the ledger accounts. 2. Journalize (use 3 as the page number) and...
-
Do you think that the experts' recommendations will be sufficient to get most of the administrators to fill out the rating forms properly? Why or why not? What additional actions (if any) do you...
-
12. ROLE REVERSAL Write a multiple choice question that deals with the liability of principals for the acts of their employees.
-
On July 1, 2012, Bliss industries Inc. issued $24,000,000 of 20-year, 11% bonds at a market (effective) interest rate of 14%, receiving cash of $19,200,577. Interest on the bonds is payable...
-
How to solve & solution 3. On October 23 an investor holds 80,000 shares of a certain stock. The market price is $12 per share. The investor wants to double the market exposure of her shares over ...
-
On January 1, 2010, Phelps Company purchased an 85% interest in Sloane Company for $955,000 when the retained earnings of Sloane Company were $150,000. The difference between implied and book value...
-
Multi Investment Co.'s investment in Sherman Mfg. makes up 40% of Multi earnings and 30% of their assets. Robert Landry has an opportunity to aud owns an immaterial amount of stock in Sherman's...
-
Which of the following ratios is least applicable to the audit of the valuation assertion of accounts receivable? a. Ratio of bad debt expense to sales. b. Current ratio. c. Accounts receivable...
-
What is (a) a direct cost, (b) an indirect cost?
-
When auditing the prepaid insurance account, which of the following procedures would generally not be performed by the auditor? a. Re compute the portion of the premium that expired during the year....
-
As a team, discuss other methods you could use to select class projects. Be sure to review the other methods described in this chapter (besides a weighted scoring model). Document your analysis of...
-
Why do shareholders not have an automatic right to information?
-
dividend payment linked to profits left out after meeting the expansion needs is based on____theory policy ?
-
Write out the formula for the total costs of carrying and ordering inventory, and then use the formula to derive the EOQ model. Andria Mullins, financial manager of Webster Electronics, has been...
-
During 2012, William purchases the following capital assets for use in his catering business: New passenger automobile (September 30)........................$21,500 Baking equipment (June 30)...
-
Deborah purchases a new $30,000 car in 2012 to use exclusively in her business. If Deborah does not elect to expense or take bonus depreciation in 2012 and holds the car until it is fully...
-
On September 14, 2012, Jay purchased a passenger automobile that is used 75 percent in his accounting business. The automobile has a basis for depreciation purposes of $35,000, and Jay uses the...
-
Consider the function \(f(x)=x, 0
-
Rewrite the solution to Problem 3 and identify the initial value Green's functions. Data from Problem 3 Find product solutions, \(u(x, t)=b(t) \phi(x)\), to the wave equation satisfying the boundary...
-
Established less than 50 years ago, Honda Motor Co. Ltd. of Japan is a leading international manufacturer of automobiles and the largest manufacturer of motorcycles in the world. As a Japanese...

Study smarter with the SolutionInn App