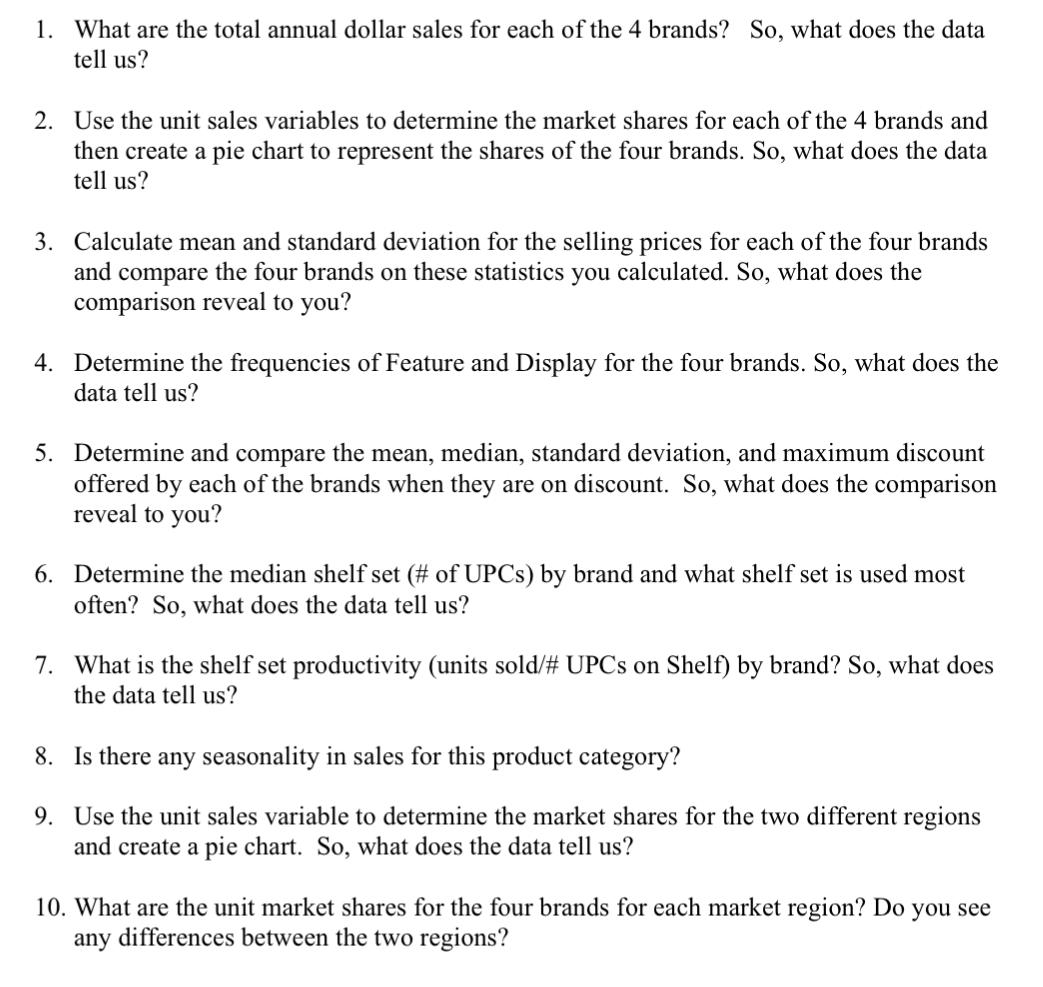
1. What are the total annual dollar sales for each of the 4 brands? So, what...
Fantastic news! We've Found the answer you've been seeking!
Question:
Transcribed Image Text:
1. What are the total annual dollar sales for each of the 4 brands? So, what does the data tell us? 2. Use the unit sales variables to determine the market shares for each of the 4 brands and then create a pie chart to represent the shares of the four brands. So, what does the data tell us? 3. Calculate mean and standard deviation for the selling prices for each of the four brands and compare the four brands on these statistics you calculated. So, what does the comparison reveal to you? 4. Determine the frequencies of Feature and Display for the four brands. So, what does the data tell us? 5. Determine and compare the mean, median, standard deviation, and maximum discount offered by each of the brands when they are on discount. So, what does the comparison reveal to you? 6. Determine the median shelf set (# of UPCs) by brand and what shelf set is used most often? So, what does the data tell us? 7. What is the shelf set productivity (units sold/# UPCs on Shelf) by brand? So, what does the data tell us? 8. Is there any seasonality in sales for this product category? 9. Use the unit sales variable to determine the market shares for the two different regions and create a pie chart. So, what does the data tell us? 10. What are the unit market shares for the four brands for each market region? Do you see any differences between the two regions? 1. What are the total annual dollar sales for each of the 4 brands? So, what does the data tell us? 2. Use the unit sales variables to determine the market shares for each of the 4 brands and then create a pie chart to represent the shares of the four brands. So, what does the data tell us? 3. Calculate mean and standard deviation for the selling prices for each of the four brands and compare the four brands on these statistics you calculated. So, what does the comparison reveal to you? 4. Determine the frequencies of Feature and Display for the four brands. So, what does the data tell us? 5. Determine and compare the mean, median, standard deviation, and maximum discount offered by each of the brands when they are on discount. So, what does the comparison reveal to you? 6. Determine the median shelf set (# of UPCs) by brand and what shelf set is used most often? So, what does the data tell us? 7. What is the shelf set productivity (units sold/# UPCs on Shelf) by brand? So, what does the data tell us? 8. Is there any seasonality in sales for this product category? 9. Use the unit sales variable to determine the market shares for the two different regions and create a pie chart. So, what does the data tell us? 10. What are the unit market shares for the four brands for each market region? Do you see any differences between the two regions?
Expert Answer:
Related Book For
Managerial Accounting for Managers
ISBN: 978-1259578540
4th edition
Authors: Eric Noreen, Peter Brewer, Ray Garrison
Posted Date:
Students also viewed these marketing questions
-
Planning is one of the most important management functions in any business. A front office managers first step in planning should involve determine the departments goals. Planning also includes...
-
In the Cracker worksheet, create an If statement where the result equals 1 if the customer: bought the Sunshine brand (reported in column O) and 0 otherwise in cell P2 & copy down to row 3293;...
-
IfAUB=AUC and An B=An C, then B = C. Statement-2 AU (BOC) = (AUB) n (AUC)
-
Figero Inc. has $350,000 of income in 2014. During that same time, it declared preferred dividends in the amount of $13,000. The following activities affecting common shares occurred during the year:...
-
Postural hypotension is the occurrence of low systolic blood pressure when a person stands up too quickly from a reclining position. A brain blood pressure lower than 90 mm of Hg can cause fainting...
-
Define configuration management (CM).
-
The executive director of Mutt Rescue (MR) animal shelter has asked you to prepare an annual budget for the coming fiscal year as well as a flexible budget based on a 5 percent increase in the number...
-
(a) Record the above transactions. On January 1, 2024, Granger Corporation had 79,000 common shares, recorded at $545,100, and retained earnings of $1 million. During the year, the following...
-
Call center A processed 1.2 million phone orders for a total of 2.4 million items. 50% of the orders are new customers and it takes 7 minutes to set up an order for a new customer. 50% of the orders...
-
Running a Profit and Loss report every month and saving them as custom reports to collate them later Running a Profit and Loss report every month and keeping a spreadsheet of the figures Running a...
-
The trial balance extracted from the books of Tailor Times Ltd at 31 December 2016 was as follows: You are given the following additional information: (1) The authorized and issued share capital is...
-
How does the exponential smoothing method of time series differ from the moving average method?
-
You are to draw up a statement of profit or loss for the year ending 31 December 2015, and a statement of financial position as at that date from the following trial balance and details of Partido...
-
What is the difference between time series and causal forecasting methods?
-
What are the components of a time-series model? How can you determine which pattern exists over time and which model you should use?
-
On April 10, 2016, when the spot rate is $1.18/, a U.S. company sells merchandise to a customer in Italy. The spot rate is $1.19/ on June 30, the companys year-end. Payment of 110,000 is received on...
-
Suppose you need to answer any four of seven essay questions on a history test and you can answer them in any order. a. How many different question combinations are possible? b. What is the...
-
The Walton Toy Company manufactures a line of dolls and a doll dress sewing kit. Demand for the dolls is increasing, and management requests assistance from you in determining an economical sales and...
-
Adger Corporation is a service company that measures its output based on the number of customers served. The company provided the following fixed and variable cost estimates that it uses for...
-
The Excel worksheet form that appears below is to be used to recreate Exhibit 2-9. Download the workbook from Connect, where you will also receive instructions about how to use this worksheet....
-
You have been asked to join the hospitals task force for developing a plan to increase the organizations workforce diversity from its current 20% level to 40% over the next 5 years. How does your...
-
Visit the Hofstede Centre (https://geerthofstede.com/culture-geerthofstede- gert-jan-hofstede/6d-model-of-nationalculture/) and review the scores by country for the various cultural dimensions that...
-
With diverse patient populations come language translation issues. Medical interpretation is a challenge facing most health organizations. Medical interpretation and translation services are costly....
Study smarter with the SolutionInn App