Question
(12.2) The data in Table EX 12.2 records the patient falls in three care units over a seven- teen-week period. a. For each unit,

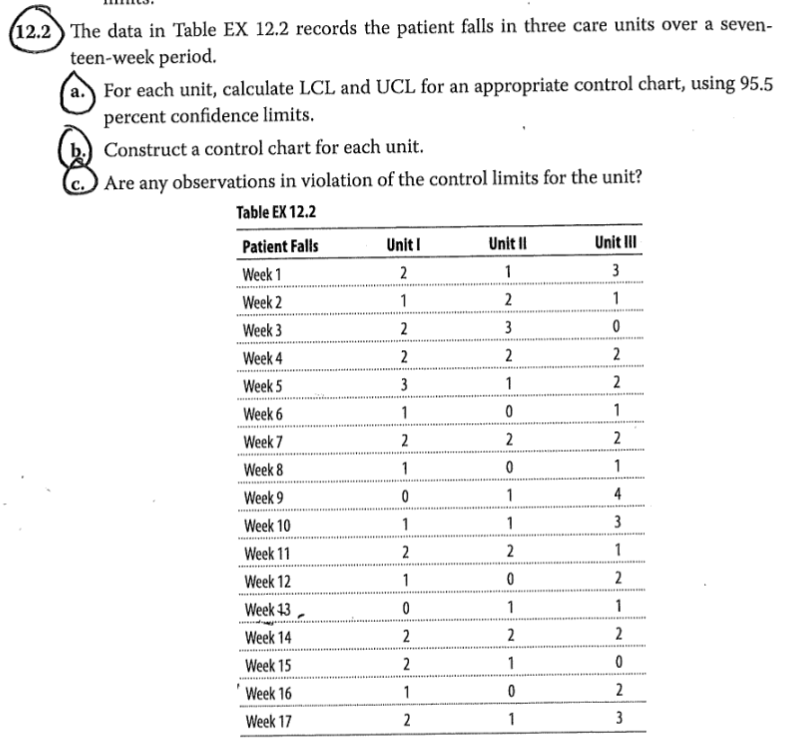
(12.2) The data in Table EX 12.2 records the patient falls in three care units over a seven- teen-week period. a. For each unit, calculate LCL and UCL for an appropriate control chart, using 95.5 percent confidence limits. Construct a control chart for each unit. Are any observations in violation of the control limits for the unit? Table EX 12.2 Patient Falls Week 1 Week 2 Week 3 Week 4 Week 5 Week 6 Week 7 Week 8 Week 9 Week 10 Week 11 Week 12 Week 13 Week 14 Week 15 Week 16 Week 17 Unit I 2 1 2 2 3 1 2 1 0 1 2 1 0 2 2 1 2 Unit II 1 2 3 2 1 0 2 0 1 1 2 0 1 2 1 0 1 Unit III 3 1 0 2 2 1 2 1 4 3 1 2 1 2 0 2 3
Step by Step Solution
3.41 Rating (148 Votes )
There are 3 Steps involved in it
Step: 1
A THUMBS UP TO THIS ANSWER IS HIG...
Get Instant Access to Expert-Tailored Solutions
See step-by-step solutions with expert insights and AI powered tools for academic success
Step: 2

Step: 3

Ace Your Homework with AI
Get the answers you need in no time with our AI-driven, step-by-step assistance
Get StartedRecommended Textbook for
Introduction To Statistical Quality Control
Authors: Douglas C Montgomery
7th Edition
1118146816, 978-1-118-3225, 978-1118146811
Students also viewed these General Management questions
Question
Answered: 1 week ago
Question
Answered: 1 week ago
Question
Answered: 1 week ago
Question
Answered: 1 week ago
Question
Answered: 1 week ago
Question
Answered: 1 week ago
Question
Answered: 1 week ago
Question
Answered: 1 week ago
Question
Answered: 1 week ago
Question
Answered: 1 week ago
Question
Answered: 1 week ago
Question
Answered: 1 week ago
Question
Answered: 1 week ago
Question
Answered: 1 week ago
Question
Answered: 1 week ago
Question
Answered: 1 week ago
Question
Answered: 1 week ago
Question
Answered: 1 week ago
Question
Answered: 1 week ago
Question
Answered: 1 week ago
Question
Answered: 1 week ago
View Answer in SolutionInn App


