

Imagine that you are contracted by a local news provider to study consumer demographics in relation...
Fantastic news! We've Found the answer you've been seeking!
Question:

Transcribed Image Text:
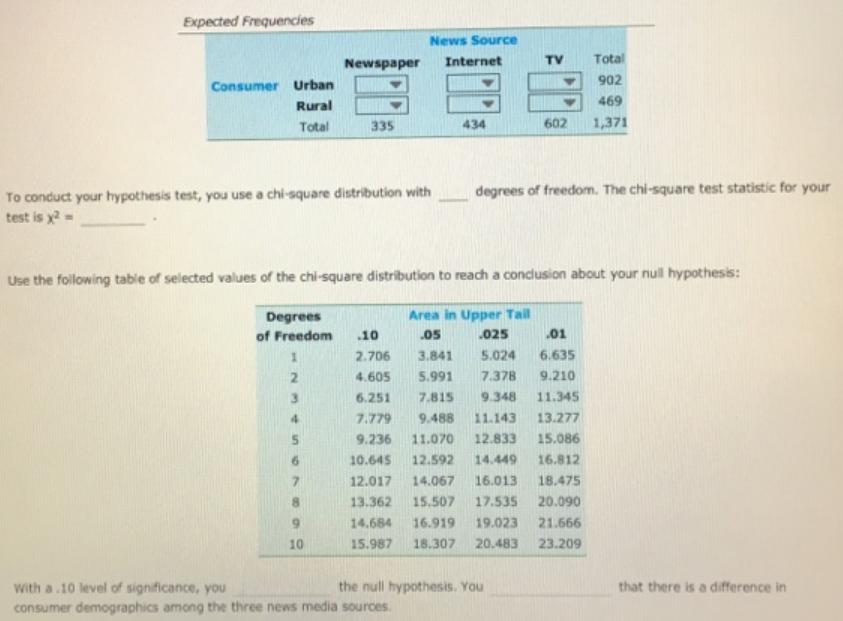
Imagine that you are contracted by a local news provider to study consumer demographics in relation to three different types of news media: print (newspaper), Internet, and television. In prior market research, the company has classified each of its customers as receiving news content primarily from only one of these three sources, and as either urban or rural residents. In order to help design effective marketing strategies, you are asked to perform a test for equality of proportions to determine whether there is a significant difference in the proportion of consumers who live in urban versus rural areas for the three media types that are offered. The three population proportions that you are interested in are: P1 = proportion of urban consumers for the population of newspaper readers P2 = proportion of urban consumers for the population of Internet news readers P3 = proportion of urban consumers for the population of TV news consumers You conduct a hypothesis test with a .10 level of significance to determine whether the proportion of urban consumers is the same for all three news sources. The null and alternate hypotheses for your test are: Ho: You collect a random sample of 1,371 consumers of the company's news content. You find that 210 of the 335 newspaper consumers, 280 of the 434 Internet consumers, and 412 of the 602 TV consumers lived in urban areas. The data are summarized in the following table: Sample Results News Source Newspaper Internet TV Total Consumer Urban 210 280 412 902 Rural 125 154 190 469 Total 335 434 602 1,371 Expected Frequencies News Source Newspaper Internet TV Total 902 Consumer Urban Rural 469 Total 335 434 602 1,371 To conduct your hypothesis test, you use a chi-square distribution with test is y?- degrees of freedom. The chi-square test statistic for your Use the following table of selected values of the chi-square distribution to reach a condusion about your null hypothesis: Area in Upper Tail Degrees of Freedom .10 05 .025 .01 2.706 3,841 5.024 6.635 4.605 5.991 7.378 9.210 6.251 7.815 9.348 11.345 4. 7.779 9.488 11.143 13.277 9.236 11.070 12.833 15.086 6. 10.645 12.592 14.449 16.812 7. 12.017 14.067 16.013 18.475 13.362 15.507 17.535 20.090 9. 14.684 16.919 19.023 21.666 10 15.987 18.307 20.483 23.209 the null hypothesis. You that there is a difference in with a .10 level of significance, you consumer demographics among the three news media sources Imagine that you are contracted by a local news provider to study consumer demographics in relation to three different types of news media: print (newspaper), Internet, and television. In prior market research, the company has classified each of its customers as receiving news content primarily from only one of these three sources, and as either urban or rural residents. In order to help design effective marketing strategies, you are asked to perform a test for equality of proportions to determine whether there is a significant difference in the proportion of consumers who live in urban versus rural areas for the three media types that are offered. The three population proportions that you are interested in are: P1 = proportion of urban consumers for the population of newspaper readers P2 = proportion of urban consumers for the population of Internet news readers P3 = proportion of urban consumers for the population of TV news consumers You conduct a hypothesis test with a .10 level of significance to determine whether the proportion of urban consumers is the same for all three news sources. The null and alternate hypotheses for your test are: Ho: You collect a random sample of 1,371 consumers of the company's news content. You find that 210 of the 335 newspaper consumers, 280 of the 434 Internet consumers, and 412 of the 602 TV consumers lived in urban areas. The data are summarized in the following table: Sample Results News Source Newspaper Internet TV Total Consumer Urban 210 280 412 902 Rural 125 154 190 469 Total 335 434 602 1,371 Expected Frequencies News Source Newspaper Internet TV Total 902 Consumer Urban Rural 469 Total 335 434 602 1,371 To conduct your hypothesis test, you use a chi-square distribution with test is y?- degrees of freedom. The chi-square test statistic for your Use the following table of selected values of the chi-square distribution to reach a condusion about your null hypothesis: Area in Upper Tail Degrees of Freedom .10 05 .025 .01 2.706 3,841 5.024 6.635 4.605 5.991 7.378 9.210 6.251 7.815 9.348 11.345 4. 7.779 9.488 11.143 13.277 9.236 11.070 12.833 15.086 6. 10.645 12.592 14.449 16.812 7. 12.017 14.067 16.013 18.475 13.362 15.507 17.535 20.090 9. 14.684 16.919 19.023 21.666 10 15.987 18.307 20.483 23.209 the null hypothesis. You that there is a difference in with a .10 level of significance, you consumer demographics among the three news media sources Imagine that you are contracted by a local news provider to study consumer demographics in relation to three different types of news media: print (newspaper), Internet, and television. In prior market research, the company has classified each of its customers as receiving news content primarily from only one of these three sources, and as either urban or rural residents. In order to help design effective marketing strategies, you are asked to perform a test for equality of proportions to determine whether there is a significant difference in the proportion of consumers who live in urban versus rural areas for the three media types that are offered. The three population proportions that you are interested in are: P1 = proportion of urban consumers for the population of newspaper readers P2 = proportion of urban consumers for the population of Internet news readers P3 = proportion of urban consumers for the population of TV news consumers You conduct a hypothesis test with a .10 level of significance to determine whether the proportion of urban consumers is the same for all three news sources. The null and alternate hypotheses for your test are: Ho: You collect a random sample of 1,371 consumers of the company's news content. You find that 210 of the 335 newspaper consumers, 280 of the 434 Internet consumers, and 412 of the 602 TV consumers lived in urban areas. The data are summarized in the following table: Sample Results News Source Newspaper Internet TV Total Consumer Urban 210 280 412 902 Rural 125 154 190 469 Total 335 434 602 1,371 Expected Frequencies News Source Newspaper Internet TV Total 902 Consumer Urban Rural 469 Total 335 434 602 1,371 To conduct your hypothesis test, you use a chi-square distribution with test is y?- degrees of freedom. The chi-square test statistic for your Use the following table of selected values of the chi-square distribution to reach a condusion about your null hypothesis: Area in Upper Tail Degrees of Freedom .10 05 .025 .01 2.706 3,841 5.024 6.635 4.605 5.991 7.378 9.210 6.251 7.815 9.348 11.345 4. 7.779 9.488 11.143 13.277 9.236 11.070 12.833 15.086 6. 10.645 12.592 14.449 16.812 7. 12.017 14.067 16.013 18.475 13.362 15.507 17.535 20.090 9. 14.684 16.919 19.023 21.666 10 15.987 18.307 20.483 23.209 the null hypothesis. You that there is a difference in with a .10 level of significance, you consumer demographics among the three news media sources Imagine that you are contracted by a local news provider to study consumer demographics in relation to three different types of news media: print (newspaper), Internet, and television. In prior market research, the company has classified each of its customers as receiving news content primarily from only one of these three sources, and as either urban or rural residents. In order to help design effective marketing strategies, you are asked to perform a test for equality of proportions to determine whether there is a significant difference in the proportion of consumers who live in urban versus rural areas for the three media types that are offered. The three population proportions that you are interested in are: P1 = proportion of urban consumers for the population of newspaper readers P2 = proportion of urban consumers for the population of Internet news readers P3 = proportion of urban consumers for the population of TV news consumers You conduct a hypothesis test with a .10 level of significance to determine whether the proportion of urban consumers is the same for all three news sources. The null and alternate hypotheses for your test are: Ho: You collect a random sample of 1,371 consumers of the company's news content. You find that 210 of the 335 newspaper consumers, 280 of the 434 Internet consumers, and 412 of the 602 TV consumers lived in urban areas. The data are summarized in the following table: Sample Results News Source Newspaper Internet TV Total Consumer Urban 210 280 412 902 Rural 125 154 190 469 Total 335 434 602 1,371 Expected Frequencies News Source Newspaper Internet TV Total 902 Consumer Urban Rural 469 Total 335 434 602 1,371 To conduct your hypothesis test, you use a chi-square distribution with test is y?- degrees of freedom. The chi-square test statistic for your Use the following table of selected values of the chi-square distribution to reach a condusion about your null hypothesis: Area in Upper Tail Degrees of Freedom .10 05 .025 .01 2.706 3,841 5.024 6.635 4.605 5.991 7.378 9.210 6.251 7.815 9.348 11.345 4. 7.779 9.488 11.143 13.277 9.236 11.070 12.833 15.086 6. 10.645 12.592 14.449 16.812 7. 12.017 14.067 16.013 18.475 13.362 15.507 17.535 20.090 9. 14.684 16.919 19.023 21.666 10 15.987 18.307 20.483 23.209 the null hypothesis. You that there is a difference in with a .10 level of significance, you consumer demographics among the three news media sources Imagine that you are contracted by a local news provider to study consumer demographics in relation to three different types of news media: print (newspaper), Internet, and television. In prior market research, the company has classified each of its customers as receiving news content primarily from only one of these three sources, and as either urban or rural residents. In order to help design effective marketing strategies, you are asked to perform a test for equality of proportions to determine whether there is a significant difference in the proportion of consumers who live in urban versus rural areas for the three media types that are offered. The three population proportions that you are interested in are: P1 = proportion of urban consumers for the population of newspaper readers P2 = proportion of urban consumers for the population of Internet news readers P3 = proportion of urban consumers for the population of TV news consumers You conduct a hypothesis test with a .10 level of significance to determine whether the proportion of urban consumers is the same for all three news sources. The null and alternate hypotheses for your test are: Ho: You collect a random sample of 1,371 consumers of the company's news content. You find that 210 of the 335 newspaper consumers, 280 of the 434 Internet consumers, and 412 of the 602 TV consumers lived in urban areas. The data are summarized in the following table: Sample Results News Source Newspaper Internet TV Total Consumer Urban 210 280 412 902 Rural 125 154 190 469 Total 335 434 602 1,371 Expected Frequencies News Source Newspaper Internet TV Total 902 Consumer Urban Rural 469 Total 335 434 602 1,371 To conduct your hypothesis test, you use a chi-square distribution with test is y?- degrees of freedom. The chi-square test statistic for your Use the following table of selected values of the chi-square distribution to reach a condusion about your null hypothesis: Area in Upper Tail Degrees of Freedom .10 05 .025 .01 2.706 3,841 5.024 6.635 4.605 5.991 7.378 9.210 6.251 7.815 9.348 11.345 4. 7.779 9.488 11.143 13.277 9.236 11.070 12.833 15.086 6. 10.645 12.592 14.449 16.812 7. 12.017 14.067 16.013 18.475 13.362 15.507 17.535 20.090 9. 14.684 16.919 19.023 21.666 10 15.987 18.307 20.483 23.209 the null hypothesis. You that there is a difference in with a .10 level of significance, you consumer demographics among the three news media sources Imagine that you are contracted by a local news provider to study consumer demographics in relation to three different types of news media: print (newspaper), Internet, and television. In prior market research, the company has classified each of its customers as receiving news content primarily from only one of these three sources, and as either urban or rural residents. In order to help design effective marketing strategies, you are asked to perform a test for equality of proportions to determine whether there is a significant difference in the proportion of consumers who live in urban versus rural areas for the three media types that are offered. The three population proportions that you are interested in are: P1 = proportion of urban consumers for the population of newspaper readers P2 = proportion of urban consumers for the population of Internet news readers P3 = proportion of urban consumers for the population of TV news consumers You conduct a hypothesis test with a .10 level of significance to determine whether the proportion of urban consumers is the same for all three news sources. The null and alternate hypotheses for your test are: Ho: You collect a random sample of 1,371 consumers of the company's news content. You find that 210 of the 335 newspaper consumers, 280 of the 434 Internet consumers, and 412 of the 602 TV consumers lived in urban areas. The data are summarized in the following table: Sample Results News Source Newspaper Internet TV Total Consumer Urban 210 280 412 902 Rural 125 154 190 469 Total 335 434 602 1,371 Expected Frequencies News Source Newspaper Internet TV Total 902 Consumer Urban Rural 469 Total 335 434 602 1,371 To conduct your hypothesis test, you use a chi-square distribution with test is y?- degrees of freedom. The chi-square test statistic for your Use the following table of selected values of the chi-square distribution to reach a condusion about your null hypothesis: Area in Upper Tail Degrees of Freedom .10 05 .025 .01 2.706 3,841 5.024 6.635 4.605 5.991 7.378 9.210 6.251 7.815 9.348 11.345 4. 7.779 9.488 11.143 13.277 9.236 11.070 12.833 15.086 6. 10.645 12.592 14.449 16.812 7. 12.017 14.067 16.013 18.475 13.362 15.507 17.535 20.090 9. 14.684 16.919 19.023 21.666 10 15.987 18.307 20.483 23.209 the null hypothesis. You that there is a difference in with a .10 level of significance, you consumer demographics among the three news media sources
Expert Answer:

Related Book For 

Advertising & IMC Principles & Practice
ISBN: 978-0132163644
9th Edition
Authors: Sandra Moriarty, Nancy Mitchell, William Wells
Posted Date:
Students also viewed these general management questions
-
Imagine that you are writing the data link layer software for a line used to send data to you but not from you. The other end uses HDLC, with a 3-bit sequence number and a window size of seven...
-
Imagine that you are now working for Haagen-Dazs. What did the company do that provides evidence that it is socially and environmentally responsible? What other ways can you think of for the company...
-
For this final assignment, imagine that you are an HR Manager on a global HRM planning committee. You are required to present to upper management six (6) main concerns related to global human...
-
George bought the following amounts of Stock A over the years: (Loss amounts should be indicated with a minus sign.) Number of Adjusted Basis $ 7,200 6,270 Date Purchased Shares Stock A 11/21/1993...
-
FedEx Corporation reported the following rounded amounts (in millions): Required: 1. Determine the receivables turnover ratio and days to collect for 2013. Round your answers to one decimal place. 2....
-
What is the constrained optimization problem facing firms?
-
What the differences are between civil litigation and other types of litigation
-
On January 1, 2008, Ameen Company purchased a building for $36 million. Ameen uses straight-line depreciation for financial statement reporting and MACRS for income tax reporting. At December 31,...
-
Sammi purchased a $1,000 par value bond. The bond has coupon rate of 6%, paid annually, and matures in 6 years. If Sammi paid $1,200 to purchase the bond, what is the yield to maturity? Question 22...
-
Publishing Company, Inc. ("P") is a publicly traded C corporation engaged in the publication of professional textbooks. P has 5 million shares of voting common stock outstanding. The stock is...
-
Expand the following and determine the region of non-uniformly: e x+ e x/ 1/x 2 + Cos(/1+x 2 )
-
What are the effects of urbanization on Latin America, Africa, and the Caribbean?
-
Explain what is meant by risk-neutral pricing. What is the reason for pricing options using a risk-neutral pricing approach?
-
How have family and gender patterns in Latin America, Africa, and the Caribbean been influenced by globalization?
-
How did religion change as a result of colonialism and Western influence in the Middle East and Asia?
-
Describe the specific changes that characterized the evolution of technology from the Lower Paleolithic (Oldowan, Acheulian) through the Middle Paleolithic (Mousterian), and Upper Paleolithic periods.
-
For Tax Years 2020 and 2021, Sheila (53) was able to use the head of household filing status while she had temporary custody of her granddaughter, Mia. In February 2022, Mia moved back in with her...
-
Below is a sample of the data in the file NFLAttendance which contains the 32 teams in the National Football League, their conference affiliation, their division, and their average home attendance....
-
How can radio be used most effectively, and what are the advantages and limitations of advertising on radio?
-
Draw up a list of guidelines to use in designing a website.
-
Explain cause marketing and mission marketing. How do they differ?
-
Which one of the following can completely balance several masses revolving in different planes on a shaft? (a) A single mass in one of the planes of the revolving mass (b) A single mass in any one...
-
The curve traced by a point on the circumference of a circle which rolls along the inside of a fixed circle, is known as (a) epicycloid (b) hypocycloid (c) cardiod (d) involute.
-
Match List I with List II and select the correct answer using the codes given below the lists: List I (Forces) A. Inertia force B. Spring force C. Damping force D. Centrifugal force List II...

Study smarter with the SolutionInn App