

Question: 2. 3. 4. 5. Tableau DA 16-1: Quick Study, Computing net increase (decrease) in cash LO C1 As consultants in advisory services at an accounting
2.
3.
4.
5.
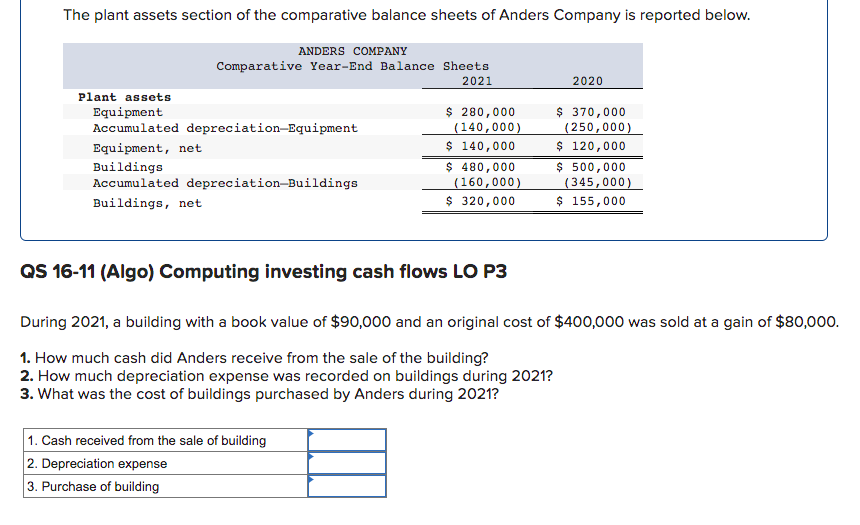
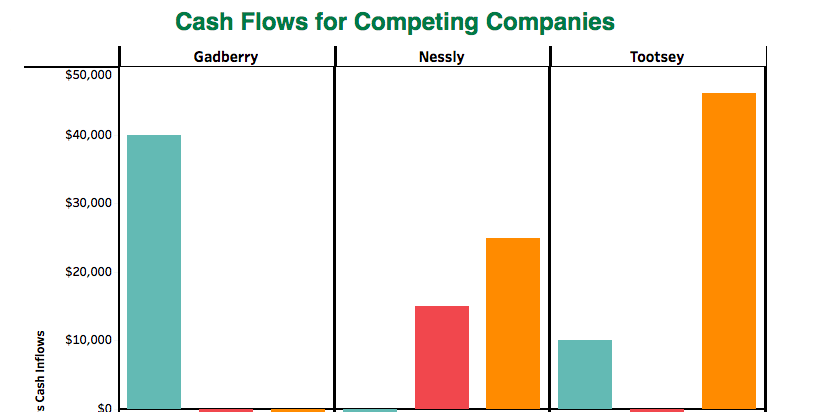
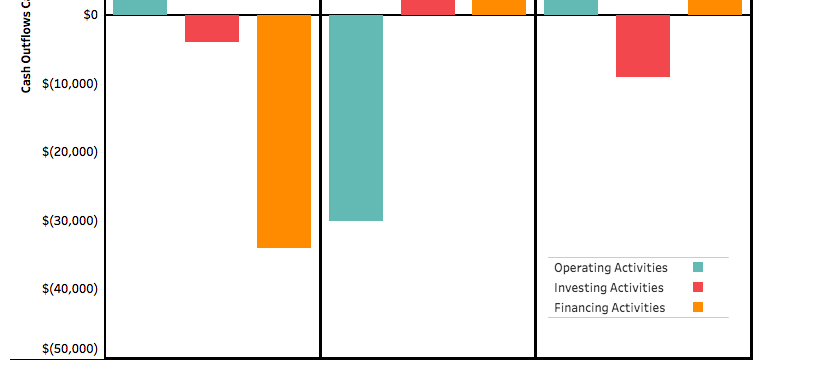
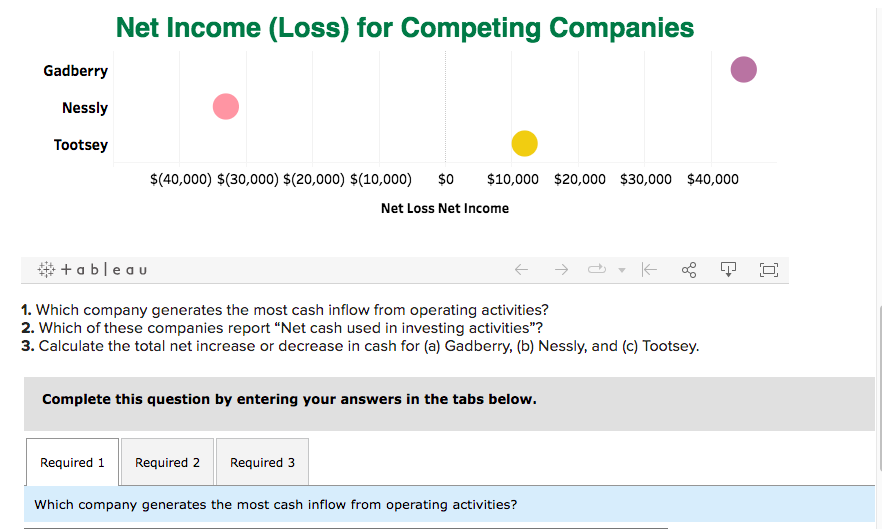
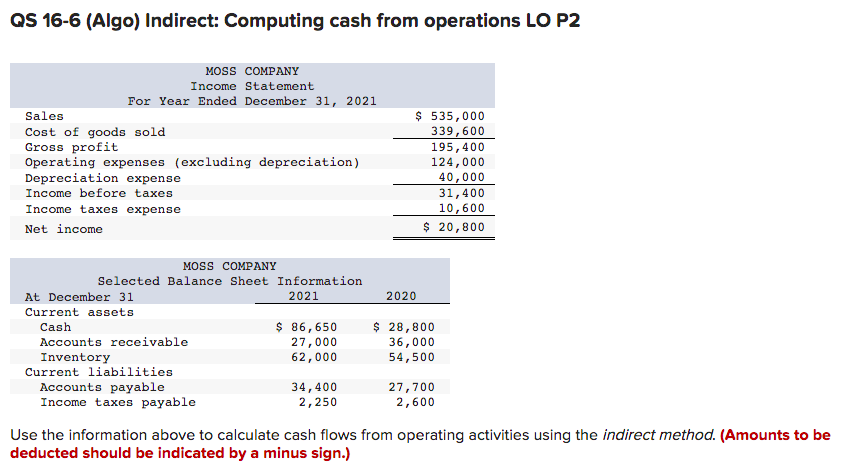
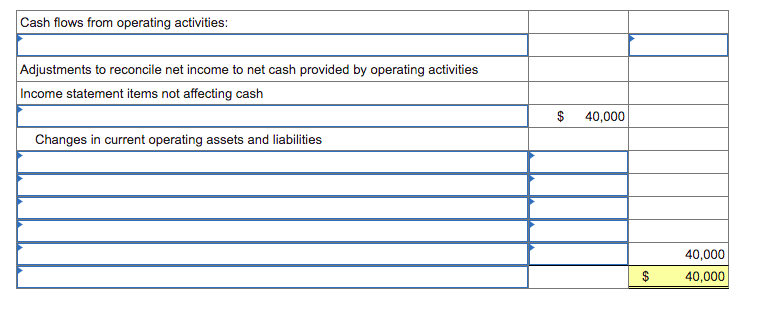
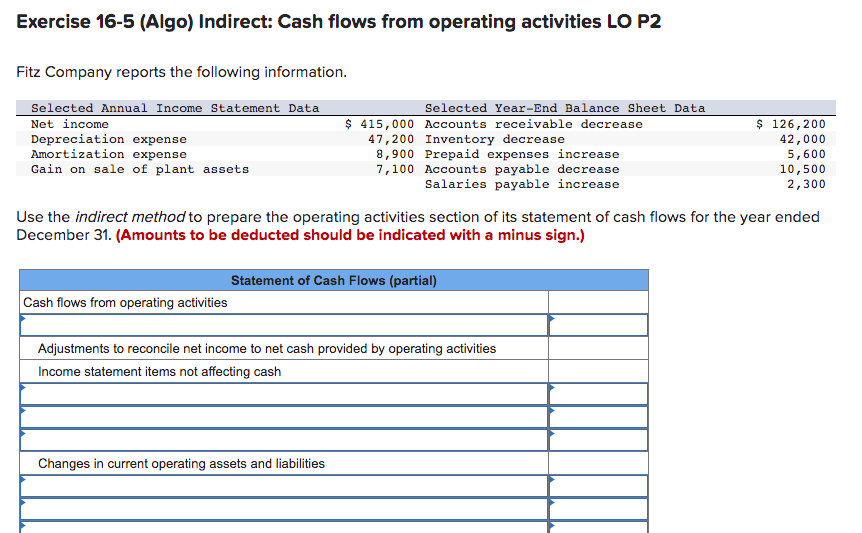
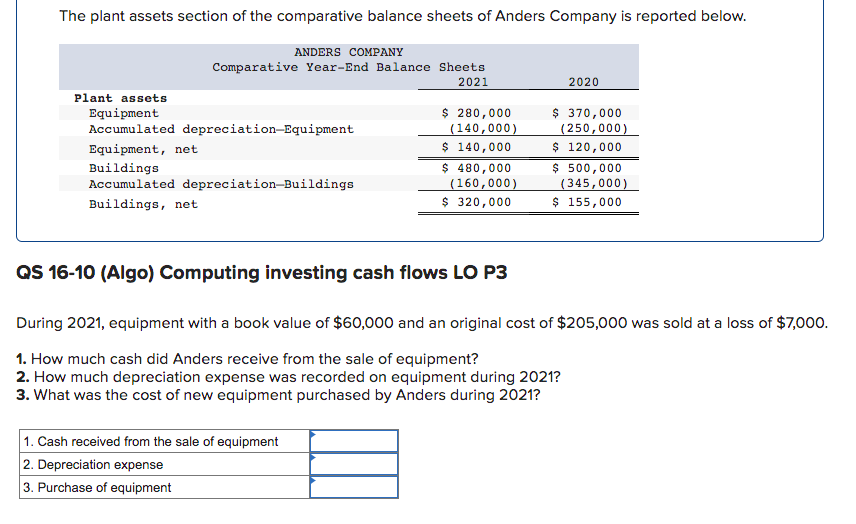
Tableau DA 16-1: Quick Study, Computing net increase (decrease) in cash LO C1 As consultants in advisory services at an accounting firm, we are hired by management of Gadberry to advise on cash flow reporting. Management is concerned about the relatively small net increase in cash, and how the company is doing compared to competitors Nessly and Tootsey. The following Tableau Dashboard will assist in our analysis. Cash Flows for Competing Companies Gadberry Nessly Tootsey $50,000 $40,000 $30,000 $20,000 $10,000 s Cash Inflows SO $0 Cash Outflows C $(10,000) $(20,000) $(30,000) $(40,000) Operating Activities Investing Activities Financing Activities $(50,000) Net Income (Loss) for Competing Companies Gadberry Nessly Tootsey $(40,000) $(30,000) $(20,000) $(10,000) $0 $10,000 $20,000 $30,000 $40,000 Net Loss Net Income *+ableau 1. Which company generates the most cash inflow from operating activities? 2. Which of these companies report "Net cash used in investing activities"? 3. Calculate the total net increase or decrease in cash for (a) Gadberry, (b) Nessly, and (c) Tootsey. Complete this question by entering your answers in the tabs below. Required 1 Required 2 Required 3 Which company generates the most cash inflow from operating activities? QS 16-6 (Algo) Indirect: Computing cash from operations LO P2 MOSS COMPANY Income Statement For Year Ended December 31, 2021 Sales Cost of goods sold Gross profit Operating expenses (excluding depreciation) Depreciation expense Income before taxes Income taxes expense Net income $ 535,000 339,600 195, 400 124,000 40,000 31,400 10,600 $ 20,800 2020 MOSS COMPANY Selected Balance Sheet Information At December 31 2021 Current assets Cash $ 86,650 $ 28,800 Accounts receivable 27,000 36,000 Inventory 62,000 54,500 Current liabilities Accounts payable 34,400 27,700 Income taxes payable 2,250 2,600 Use the information above to calculate cash flows from operating activities using the indirect method. (Amounts to be deducted should be indicated by a minus sign.) Cash flows from operating activities: Adjustments to reconcile net income to net cash provided by operating activities Income statement items not affecting cash $ 40,000 Changes in current operating assets and liabilities 40,000 40,000 $ CA Exercise 16-5 (Algo) Indirect: Cash flows from operating activities LO P2 Fitz Company reports the following information. Selected Annual Income Statement Data Net income Depreciation expense Amortization expense Gain on sale of plant assets Selected Year-End Balance Sheet Data $ 415,000 Accounts receivable decrease 47,200 Inventory decrease 8,900 Prepaid expenses increase 7,100 Accounts payable decrease Salaries payable increase $ 126,200 42,000 5,600 10,500 2,300 Use the indirect method to prepare the operating activities section of its statement of cash flows for the year ended December 31. (Amounts to be deducted should be indicated with a minus sign.) Statement of Cash Flows (partial) Cash flows from operating activities Adjustments to reconcile net income to net cash provided by operating activities Income statement items not affecting cash Changes in current operating assets and liabilities The plant assets section of the comparative balance sheets of Anders Company is reported below. 2020 ANDERS COMPANY Comparative Year-End Balance Sheets 2021 Plant assets Equipment $ 280,000 Accumulated depreciation Equipment (140,000) Equipment, net $ 140,000 Buildings $ 480,000 Accumulated depreciation-Buildings (160,000) Buildings, net $ 320,000 $ 370,000 (250,000) $ 120,000 $ 500,000 (345,000) $ 155,000 QS 16-10 (Algo) Computing investing cash flows LO P3 During 2021, equipment with a book value of $60,000 and an original cost of $205,000 was sold at a loss of $7,000. 1. How much cash did Anders receive from the sale of equipment? 2. How much depreciation expense was recorded on equipment during 2021? 3. What was the cost of new equipment purchased by Anders during 2021? 1. Cash received from the sale of equipment 2. Depreciation expense 3. Purchase of equipment The plant assets section of the comparative balance sheets of Anders Company is reported below. 2020 ANDERS COMPANY Comparative Year-End Balance Sheets 2021 Plant assets Equipment $ 280,000 Accumulated depreciation-Equipment (140,000) Equipment, net $ 140,000 Buildings $ 480,000 Accumulated depreciation-Buildings (160,000) Buildings, net $ 320,000 $ 370,000 (250,000) $ 120,000 $ 500,000 (345,000) $ 155,000 QS 16-11 (Algo) Computing investing cash flows LO P3 During 2021, a building with a book value of $90,000 and an original cost of $400,000 was sold at a gain of $80,000. 1. How much cash did Anders receive from the sale of the building? 2. How much depreciation expense was recorded on buildings during 2021? 3. What was the cost of buildings purchased by Anders during 2021? 1. Cash received from the sale of building 2. Depreciation expense 3. Purchase of building Tableau DA 16-1: Quick Study, Computing net increase (decrease) in cash LO C1 As consultants in advisory services at an accounting firm, we are hired by management of Gadberry to advise on cash flow reporting. Management is concerned about the relatively small net increase in cash, and how the company is doing compared to competitors Nessly and Tootsey. The following Tableau Dashboard will assist in our analysis. Cash Flows for Competing Companies Gadberry Nessly Tootsey $50,000 $40,000 $30,000 $20,000 $10,000 s Cash Inflows SO $0 Cash Outflows C $(10,000) $(20,000) $(30,000) $(40,000) Operating Activities Investing Activities Financing Activities $(50,000) Net Income (Loss) for Competing Companies Gadberry Nessly Tootsey $(40,000) $(30,000) $(20,000) $(10,000) $0 $10,000 $20,000 $30,000 $40,000 Net Loss Net Income *+ableau 1. Which company generates the most cash inflow from operating activities? 2. Which of these companies report "Net cash used in investing activities"? 3. Calculate the total net increase or decrease in cash for (a) Gadberry, (b) Nessly, and (c) Tootsey. Complete this question by entering your answers in the tabs below. Required 1 Required 2 Required 3 Which company generates the most cash inflow from operating activities? QS 16-6 (Algo) Indirect: Computing cash from operations LO P2 MOSS COMPANY Income Statement For Year Ended December 31, 2021 Sales Cost of goods sold Gross profit Operating expenses (excluding depreciation) Depreciation expense Income before taxes Income taxes expense Net income $ 535,000 339,600 195, 400 124,000 40,000 31,400 10,600 $ 20,800 2020 MOSS COMPANY Selected Balance Sheet Information At December 31 2021 Current assets Cash $ 86,650 $ 28,800 Accounts receivable 27,000 36,000 Inventory 62,000 54,500 Current liabilities Accounts payable 34,400 27,700 Income taxes payable 2,250 2,600 Use the information above to calculate cash flows from operating activities using the indirect method. (Amounts to be deducted should be indicated by a minus sign.) Cash flows from operating activities: Adjustments to reconcile net income to net cash provided by operating activities Income statement items not affecting cash $ 40,000 Changes in current operating assets and liabilities 40,000 40,000 $ CA Exercise 16-5 (Algo) Indirect: Cash flows from operating activities LO P2 Fitz Company reports the following information. Selected Annual Income Statement Data Net income Depreciation expense Amortization expense Gain on sale of plant assets Selected Year-End Balance Sheet Data $ 415,000 Accounts receivable decrease 47,200 Inventory decrease 8,900 Prepaid expenses increase 7,100 Accounts payable decrease Salaries payable increase $ 126,200 42,000 5,600 10,500 2,300 Use the indirect method to prepare the operating activities section of its statement of cash flows for the year ended December 31. (Amounts to be deducted should be indicated with a minus sign.) Statement of Cash Flows (partial) Cash flows from operating activities Adjustments to reconcile net income to net cash provided by operating activities Income statement items not affecting cash Changes in current operating assets and liabilities The plant assets section of the comparative balance sheets of Anders Company is reported below. 2020 ANDERS COMPANY Comparative Year-End Balance Sheets 2021 Plant assets Equipment $ 280,000 Accumulated depreciation Equipment (140,000) Equipment, net $ 140,000 Buildings $ 480,000 Accumulated depreciation-Buildings (160,000) Buildings, net $ 320,000 $ 370,000 (250,000) $ 120,000 $ 500,000 (345,000) $ 155,000 QS 16-10 (Algo) Computing investing cash flows LO P3 During 2021, equipment with a book value of $60,000 and an original cost of $205,000 was sold at a loss of $7,000. 1. How much cash did Anders receive from the sale of equipment? 2. How much depreciation expense was recorded on equipment during 2021? 3. What was the cost of new equipment purchased by Anders during 2021? 1. Cash received from the sale of equipment 2. Depreciation expense 3. Purchase of equipment The plant assets section of the comparative balance sheets of Anders Company is reported below. 2020 ANDERS COMPANY Comparative Year-End Balance Sheets 2021 Plant assets Equipment $ 280,000 Accumulated depreciation-Equipment (140,000) Equipment, net $ 140,000 Buildings $ 480,000 Accumulated depreciation-Buildings (160,000) Buildings, net $ 320,000 $ 370,000 (250,000) $ 120,000 $ 500,000 (345,000) $ 155,000 QS 16-11 (Algo) Computing investing cash flows LO P3 During 2021, a building with a book value of $90,000 and an original cost of $400,000 was sold at a gain of $80,000. 1. How much cash did Anders receive from the sale of the building? 2. How much depreciation expense was recorded on buildings during 2021? 3. What was the cost of buildings purchased by Anders during 2021? 1. Cash received from the sale of building 2. Depreciation expense 3. Purchase of building
Step by Step Solution
There are 3 Steps involved in it

Get step-by-step solutions from verified subject matter experts