Answered step by step
Verified Expert Solution
Question
1 Approved Answer
2. A manufacturer of soap and detergents has three plants, located in Cincinnati, Denver and Atlanta. Warehouses are located in New York, Boston, Chicago,
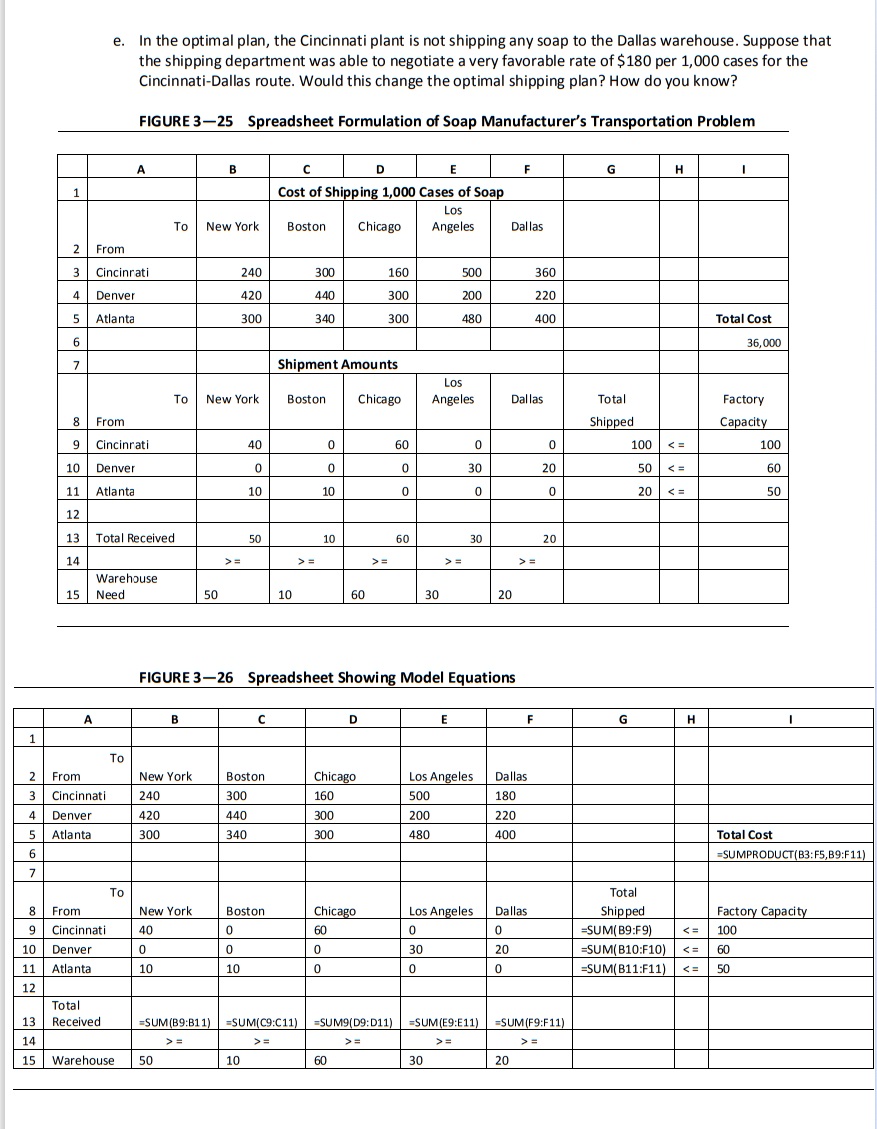
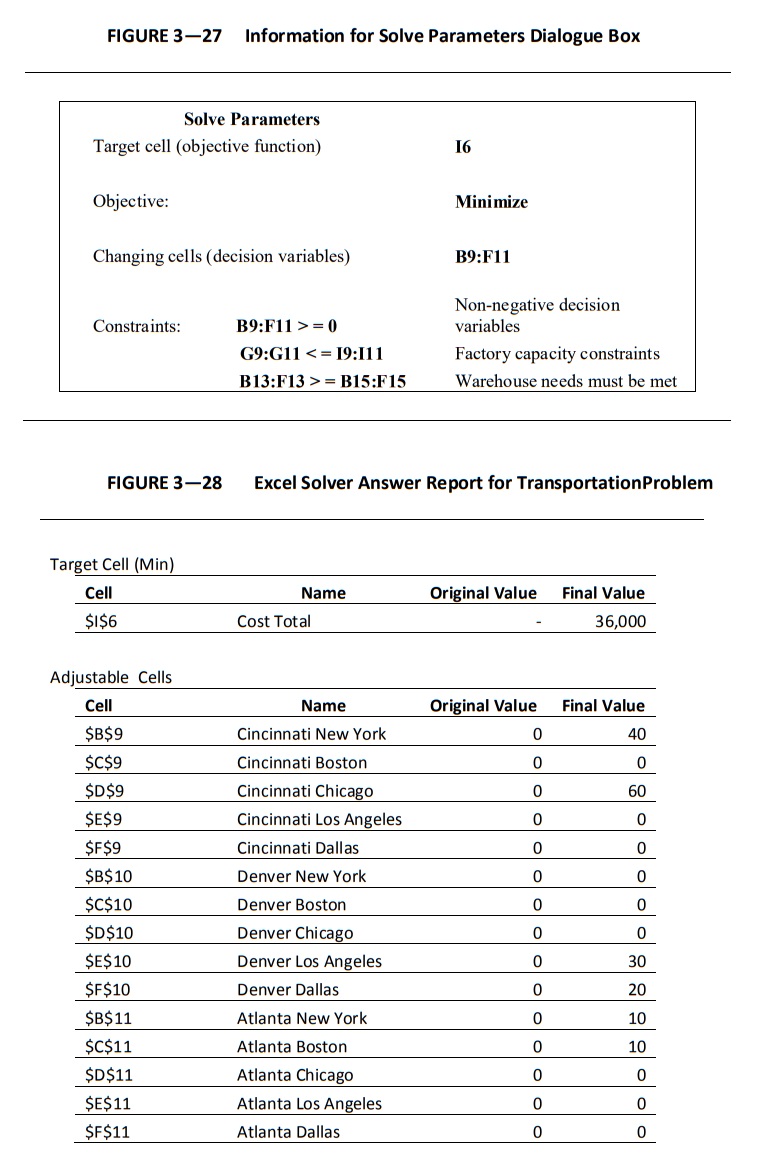
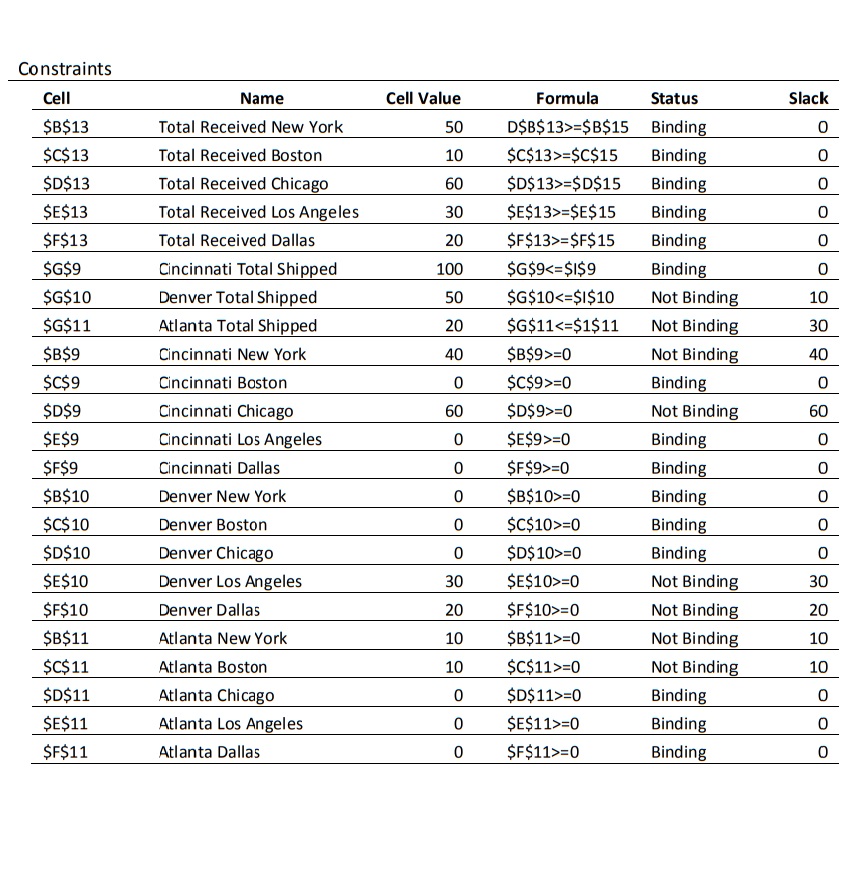
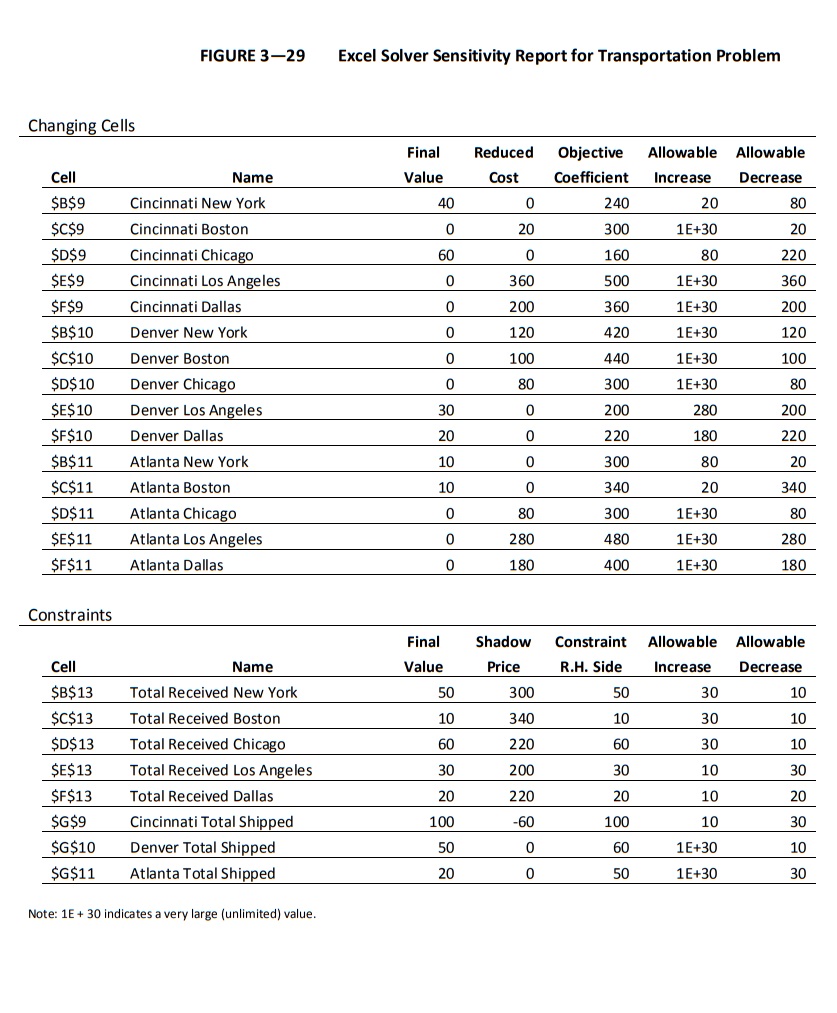
2. A manufacturer of soap and detergents has three plants, located in Cincinnati, Denver and Atlanta. Warehouses are located in New York, Boston, Chicago, Los Angeles and Dallas. The decision problem is which factories should supply each warehouse. The model has been formulated on the spreadsheet shown as Figure 3-25. The costs of shipping 1,000 cases from each factory to each warehouse are shown in cells B3 through F5 in the upper part of the spreadsheet. The decision variables (the amounts to be shipped over each route) are shown in cells B9 through F11 in the lower part of the figure. The optimal shipping schedule is shown. The constraints relate to the capacities of the factories (shown in column I) and the amounts needed at each warehouse (shown in row 15). Figure 3-26 shows the model equations. Note that the objective function in cell 16 is the SUMPRODUCT function for the shipping costs and shipping amounts. It multiplies each amount shipped by its cost, then sums them up. The sums of the rows are in column G (amounts shipped) and the sums of the columns in row 13 (amount received at each warehouse). Finally, Figure 3-27 shows the contents of the Solver Parameter dialogue box. Examine these spreadsheets carefully to be sure you understand the formulation. Figure 3-28 gives the Solver Answer Report and Figure 3-29 gives the Solver Sensitivity Report for this problem. Answer the following questions by referring to the spreadsheet and Solver reports. a. Put in words the optimal production and shipping plan for this manufacturer. b. Suppose, for policy reasons, the company wanted to ship at least 1,000 cases from Cincinnati to Dallas. Would this increase the cost? By how much? c. Suppose the company was considering a marketing program to increase the sales in the warehouse regions. If all else is equal (except shipping costs), which warehouse region would yield the most profit? Which would give the least profit? d. Suppose the capacity of the Cincinnati plant can be increased by 10 percent by using overtime. The cost of this would be $1,000. Should this be done? Why or why not? e. In the optimal plan, the Cincinnati plant is not shipping any soap to the Dallas warehouse. Suppose that the shipping department was able to negotiate a very favorable rate of $180 per 1,000 cases for the Cincinnati-Dallas route. Would this change the optimal shipping plan? How do you know? e. In the optimal plan, the Cincinnati plant is not shipping any soap to the Dallas warehouse. Suppose that the shipping department was able to negotiate a very favorable rate of $180 per 1,000 cases for the Cincinnati-Dallas route. Would this change the optimal shipping plan? How do you know? FIGURE 3-25 Spreadsheet Formulation of Soap Manufacturer's Transportation Problem A B 1 D E Cost of Shipping 1,000 Cases of Soap F G H To New York Boston Los Chicago Angeles Dallas 2 From 3 Cincinnati 240 300 160 500 360 4 Denver 420 440 300 200 220 5 Atlanta 300 340 300 480 400 Total Cost 6 36,000 7 Shipment Amounts Los To New York Boston Chicago Angeles Dallas Total Factory 8 From Shipped Capacity 9 Cincinnati 40 0 60 0 0 100 = >= >= 10 60 30 20 FIGURE 3-26 Spreadsheet Showing Model Equations B E To 2 From New York Boston Chicago Los Angeles Dallas 3 Cincinnati 240 300 160 500 180 4 Denver 420 440 300 200 220 5 Atlanta 300 340 300 480 400 6 7 F G H Total Cost =SUMPRODUCT(B3:F5,B9:F11) To 8 From New York Boston Chicago Los Angeles 9 Cincinnati 40 0 60 0 10 Denver 0 0 0 30 Dallas 0 20 11 Atlantal 10 10 0 0 0 Total Shipped =SUM(B9:F9) 100 =SUM(B10:F10) = >= >= 10 60 30 20 =SUM9(D9:D11) =SUM(E9:E11) FIGURE 3-27 Information for Solve Parameters Dialogue Box Solve Parameters Target cell (objective function) 16 Objective: Minimize Changing cells (decision variables) B9:F11 Constraints: B9:F11 >= 0 G9:G11 19:111 B13:F13B15:F15 Non-negative decision variables Factory capacity constraints Warehouse needs must be met FIGURE 3-28 Target Cell (Min) Cell $1$6 Adjustable Cells Excel Solver Answer Report for TransportationProblem Name Original Value Cost Total Final Value 36,000 Cell Name Original Value Final Value $B$9 Cincinnati New York 0 40 $C$9 Cincinnati Boston 0 0 $D$9 Cincinnati Chicago 0 60 $E$9 Cincinnati Los Angeles 0 0 $F$9 Cincinnati Dallas 0 0 $B$10 Denver New York 0 0 $C$10 Denver Boston 0 0 $D$10 Denver Chicago 0 0 $E$10 Denver Los Angeles 0 30 $F$10 Denver Dallas 0 20 $B$11 Atlanta New York 0 10 $C$11 Atlanta Boston 0 10 $D$11 Atlanta Chicago 0 0 $E$11 Atlanta Los Angeles 0 0 $F$11 Atlanta Dallas 0 0 Constraints Cell Name Cell Value Formula Status Slack $B$13 Total Received New York 50 D$B$13>=$B$15 Binding 0 $C$13 Total Received Boston 10 $C$13>=$C$15 Binding 0 $D$13 Total Received Chicago 60 $D$13>=$D$15 Binding 0 $E$13 Total Received Los Angeles 30 $E$13>=$E$15 Binding 0 $F$13 Total Received Dallas 20 $F$13>=$F$15 Binding 0 $G$9 Cincinnati Total Shipped 100 $G$9 =0 Not Binding 60 $E$9 Cincinnati Los Angeles 0 $E$9>=0 Binding 0 $F$9 Cincinnati Dallas 0 $F$9>=0 Binding 0 $B$10 Denver New York 0 $B$10>=0 Binding 0 $C$10 Denver Boston 0 $C$10>=0 Binding 0 $D$10 Denver Chicago 0 $D$10>=0 Binding 0 $E$10 Denver Los Angeles 30 $E$10>=0 Not Binding 30 $F$10 Denver Dallas 20 $F$10>=0 Not Binding 20 $B$11 Atlanta New York 10 $B$11>=0 Not Binding 10 $C$11 Atlanta Boston 10 $C$11>=0 Not Binding 10 $D$11 Atlanta Chicago 0 $D$11>=0 Binding 0 $E$11 Atlanta Los Angeles 0 $E$11>=0 Binding 0 $F$11 Atlanta Dallas 0 $F$11>=0 Binding 0 Changing Cells FIGURE 3-29 Excel Solver Sensitivity Report for Transportation Problem Final Reduced Objective Allowable Allowable Cell Name Value Cost Coefficient Increase Decrease $B$9 Cincinnati New York 40 0 240 20 80 $C$9 Cincinnati Boston 0 20 300 1E+30 20 $D$9 Cincinnati Chicago 60 0 160 80 220 $E$9 Cincinnati Los Angeles 0 360 500 1E+30 360 $F$9 Cincinnati Dallas 0 200 360 1E+30 200 $B$10 Denver New York 0 120 420 1E+30 120 $C$10 Denver Boston 0 100 440 1E+30 100 $D$10 Denver Chicago 0 80 300 1E+30 80 $E$10 Denver Los Angeles 30 0 200 280 200 $F$10 Denver Dallas 20 0 220 180 220 $B$11 Atlanta New York 10 0 300 80 20 $C$11 Atlanta Boston 10 0 340 20 340 $D$11 Atlanta Chicago 0 80 300 1E+30 80 $E$11 Atlanta Los Angeles 0 280 480 1E+30 280 $F$11 Atlanta Dallas 0 180 400 1E+30 180 Constraints Final Shadow Constraint Allowable Allowable Cell Name Value Price R.H. Side Increase Decrease $B$13 Total Received New York 50 300 50 30 10 $C$13 Total Received Boston 10 340 10 30 10 $D$13 Total Received Chicago 60 220 60 30 10 $E$13 Total Received Los Angeles 30 200 30 10 30 $F$13 Total Received Dallas 20 220 20 10 20 $G$9 Cincinnati Total Shipped 100 -60 100 10 30 $G$10 Denver Total Shipped 50 0 60 1E+30 10 $G$11 Atlanta Total Shipped 20 0 50 1E+30 30 Note: 1E+ 30 indicates a very large (unlimited) value.
Step by Step Solution
There are 3 Steps involved in it
Step: 1

Get Instant Access to Expert-Tailored Solutions
See step-by-step solutions with expert insights and AI powered tools for academic success
Step: 2

Step: 3

Ace Your Homework with AI
Get the answers you need in no time with our AI-driven, step-by-step assistance
Get Started


