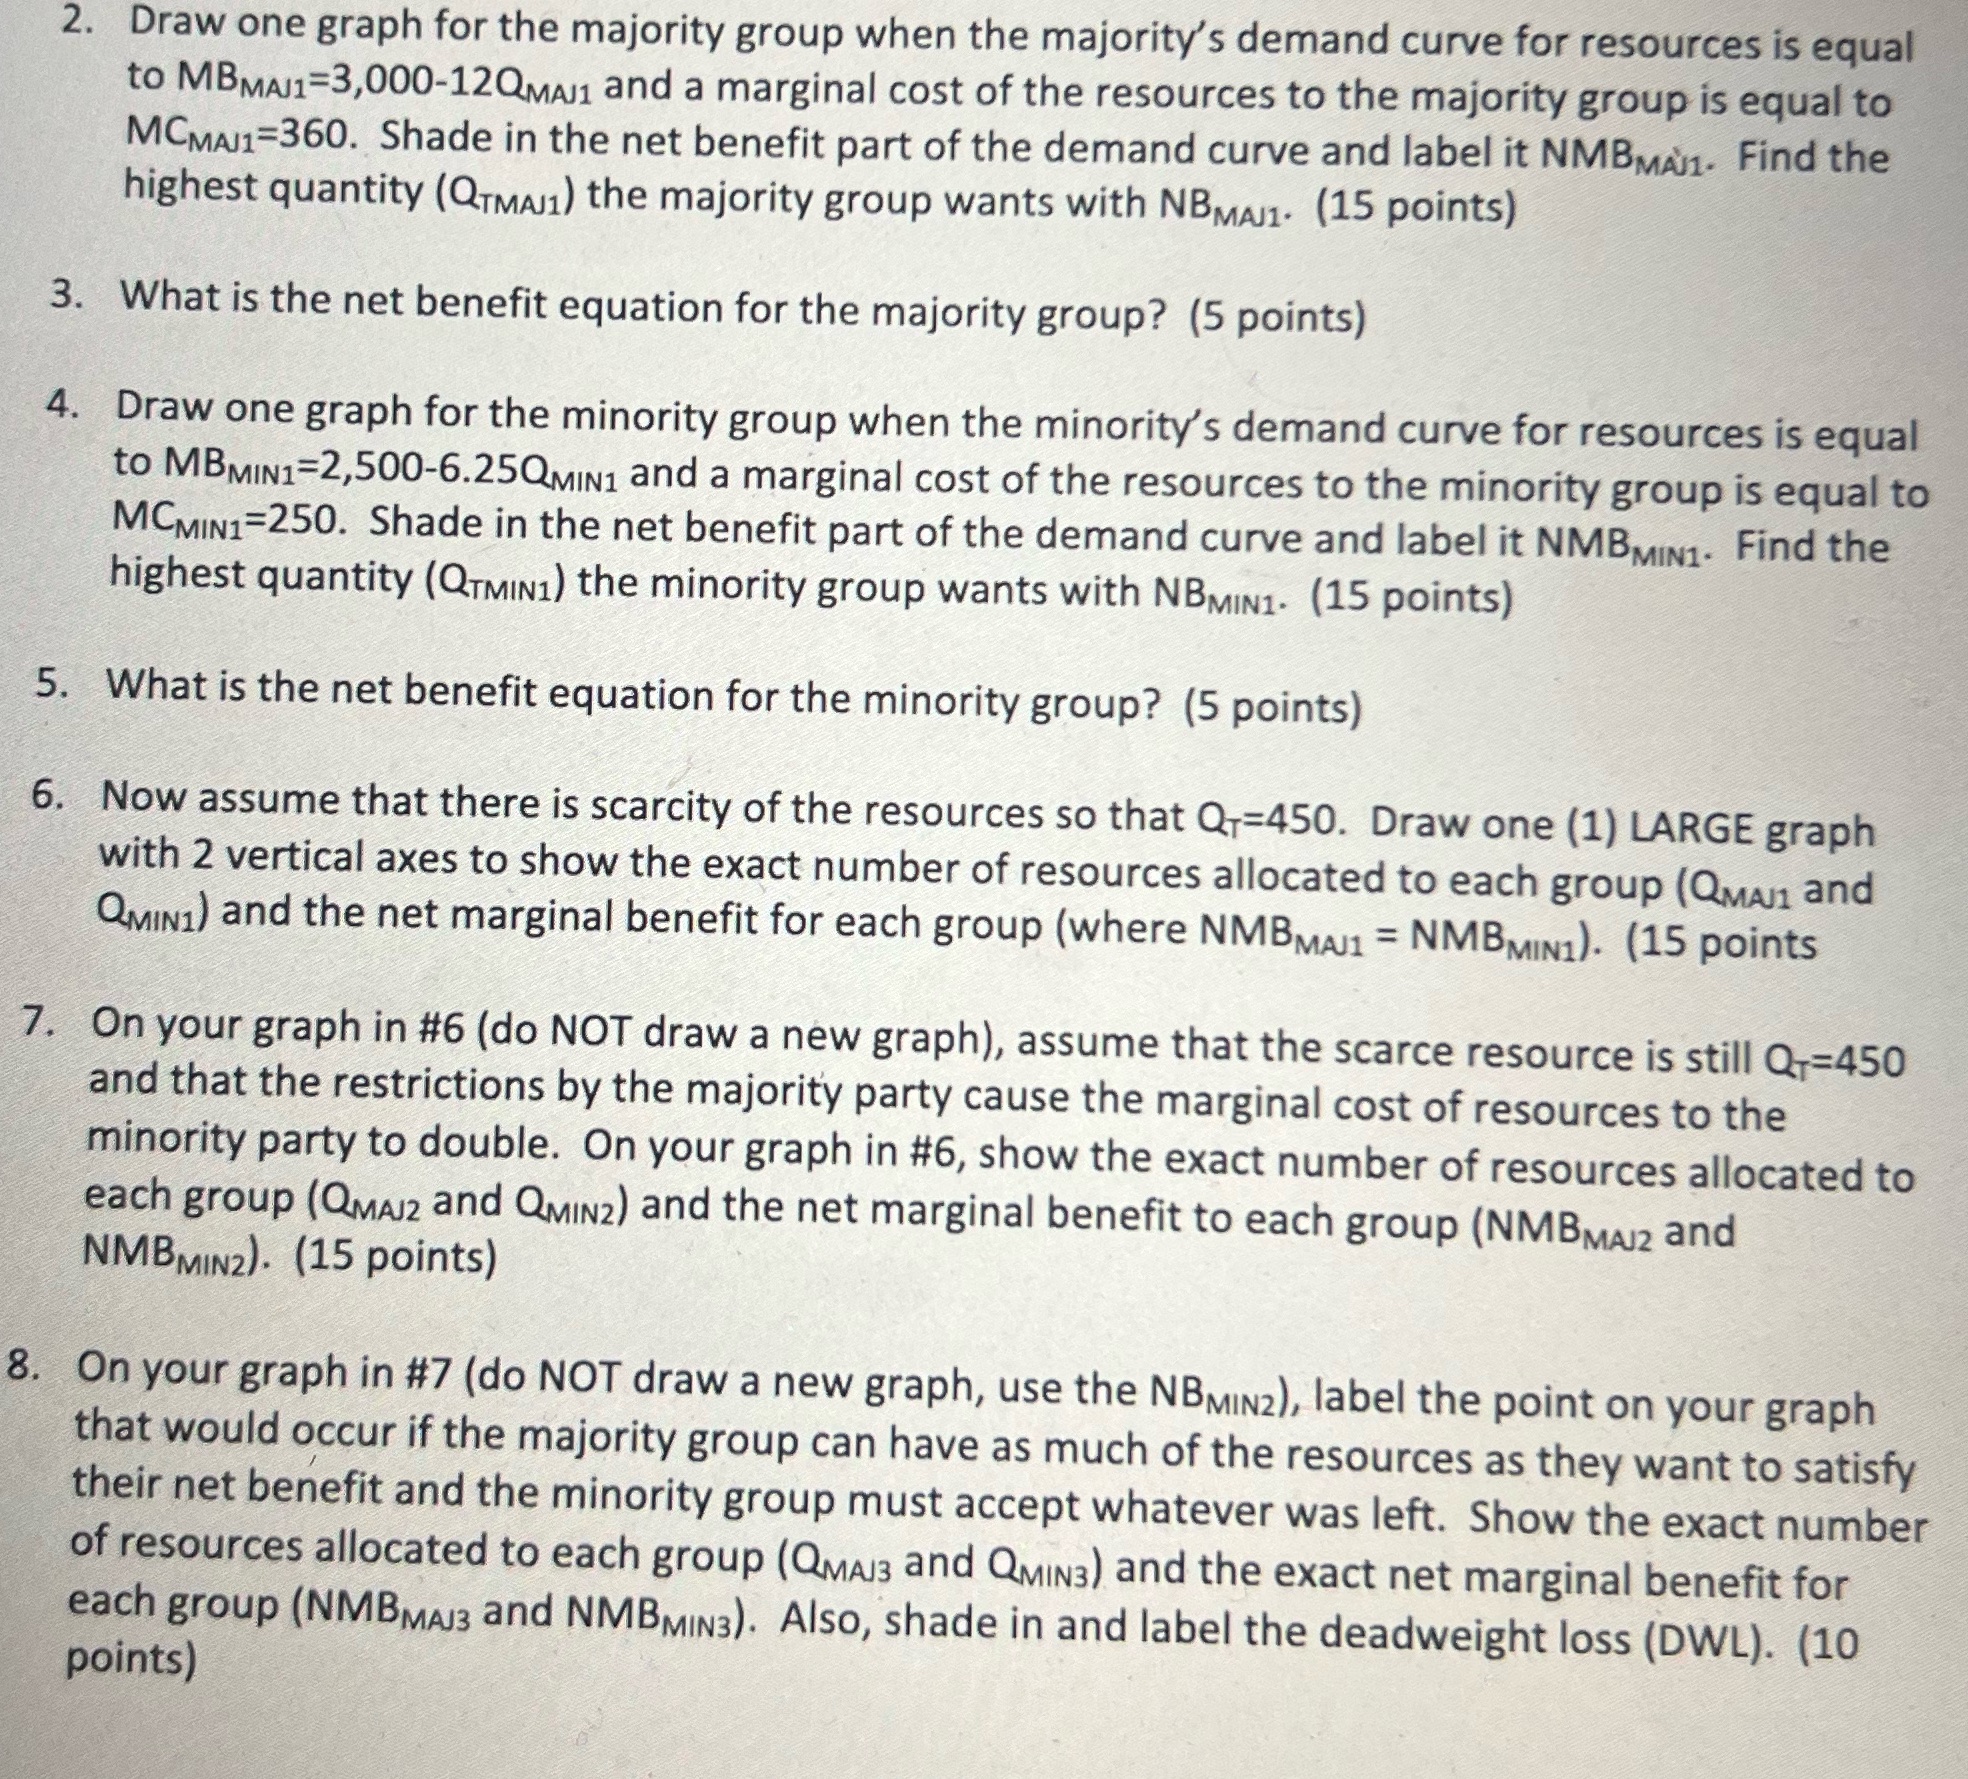
2. Draw one graph for the majority group when the majority's demand curve for resources is...
Fantastic news! We've Found the answer you've been seeking!
Question:
![image](https://dsd5zvtm8ll6.cloudfront.net/si.experts.images/questions/2024/04/662a3a50c2aba_472662a3a50986e7.jpg)
Transcribed Image Text:
2. Draw one graph for the majority group when the majority's demand curve for resources is equal to MBMAJ1 3,000-12QMAJ1 and a marginal cost of the resources to the majority group is equal to MCMAJ1-360. Shade in the net benefit part of the demand curve and label it NMBMA1. Find the highest quantity (QTMA1) the majority group wants with NBMA1. (15 points) 3. What is the net benefit equation for the majority group? (5 points) 4. Draw one graph for the minority group when the minority's demand curve for resources is equal to MBMIN1-2,500-6.25QMIN1 and a marginal cost of the resources to the minority group is equal to MCMIN1 250. Shade in the net benefit part of the demand curve and label it NMB MIN1- Find the highest quantity (QTMIN1) the minority group wants with NBMIN1- (15 points) 5. What is the net benefit equation for the minority group? (5 points) 6. Now assume that there is scarcity of the resources so that Q+=450. Draw one (1) LARGE graph with 2 vertical axes to show the exact number of resources allocated to each group (QMAJ1 and QMIN1) and the net marginal benefit for each group (where NMBMAJ = NMBMIN1). (15 points 7. On your graph in #6 (do NOT draw a new graph), assume that the scarce resource is still Q+=450 and that the restrictions by the majority party cause the marginal cost of resources to the minority party to double. On your graph in #6, show the exact number of resources allocated to each group (QMAJ2 and QMIN2) and the net marginal benefit to each group (NMBMAJ2 and NMBMIN2). (15 points) 8. On your graph in #7 (do NOT draw a new graph, use the NBMIN2), label the point on your graph that would occur if the majority group can have as much of the resources as they want to satisfy their net benefit and the minority group must accept whatever was left. Show the exact number of resources allocated to each group (QMAJ3 and QMIN3) and the exact net marginal benefit for each group (NMBMAJ3 and NMB MIN3). Also, shade in and label the deadweight loss (DWL). (10 points) 2. Draw one graph for the majority group when the majority's demand curve for resources is equal to MBMAJ1 3,000-12QMAJ1 and a marginal cost of the resources to the majority group is equal to MCMAJ1-360. Shade in the net benefit part of the demand curve and label it NMBMA1. Find the highest quantity (QTMA1) the majority group wants with NBMA1. (15 points) 3. What is the net benefit equation for the majority group? (5 points) 4. Draw one graph for the minority group when the minority's demand curve for resources is equal to MBMIN1-2,500-6.25QMIN1 and a marginal cost of the resources to the minority group is equal to MCMIN1 250. Shade in the net benefit part of the demand curve and label it NMB MIN1- Find the highest quantity (QTMIN1) the minority group wants with NBMIN1- (15 points) 5. What is the net benefit equation for the minority group? (5 points) 6. Now assume that there is scarcity of the resources so that Q+=450. Draw one (1) LARGE graph with 2 vertical axes to show the exact number of resources allocated to each group (QMAJ1 and QMIN1) and the net marginal benefit for each group (where NMBMAJ = NMBMIN1). (15 points 7. On your graph in #6 (do NOT draw a new graph), assume that the scarce resource is still Q+=450 and that the restrictions by the majority party cause the marginal cost of resources to the minority party to double. On your graph in #6, show the exact number of resources allocated to each group (QMAJ2 and QMIN2) and the net marginal benefit to each group (NMBMAJ2 and NMBMIN2). (15 points) 8. On your graph in #7 (do NOT draw a new graph, use the NBMIN2), label the point on your graph that would occur if the majority group can have as much of the resources as they want to satisfy their net benefit and the minority group must accept whatever was left. Show the exact number of resources allocated to each group (QMAJ3 and QMIN3) and the exact net marginal benefit for each group (NMBMAJ3 and NMB MIN3). Also, shade in and label the deadweight loss (DWL). (10 points)
Expert Answer:
Related Book For
Macroeconomics Principles Applications And Tools
ISBN: 9780134089034
7th Edition
Authors: Arthur O Sullivan, Steven M. Sheffrin, Stephen J. Perez
Posted Date:
Students also viewed these economics questions
-
Carter Swimming Pools has $19 million in net operating profit after taxes (NOPAT) in the current year. Carter has $12 million in total net operating assets in the current year and had $8 million in...
-
A job is scheduled to be completed in 30 weeks with a labor employment of 100 skilled operatives, 40 semi-skilled operatives and 60 unskilled operatives. The standard weekly wages of each type of...
-
A contractor has the following historical costs, expressed in $106, for the last 4 years: Cp (Cost of Production) Co (Office overhead) Cj (Job overhead) $240 m $12 m $7.0 m $320 m $14 m $5.6 m $280 m...
-
Three brothers, Daniel, David and Derrick have been discussing their respective taxation affairs and how much they dislike paying tax. None of them are Scottish taxpayers. Daniel's income for tax...
-
Who is entitled to retirement benefits under the Social Security system? Who is entitled to survivor benefits? Disability benefits? Medicare benefits?
-
Suppose that you wanted to determine the metabolic half-life of glutamine synthetase in HeLa cells (a line of human tumor cells) growing in tissue culture. Describe how this could be done...
-
In the graph on page 391, which is the most volatile asset? What motivates investors to enter this market? Volatility can be measured mathematically by variance and standard deviation. RETURN OF SOME...
-
(a) Explain the similarities and differences between standards and budgets. (b) Contrast the accounting for standards and budgets.
-
ACT470-Portfolio-Option 1 Income Statement: Sales Cost of Goods sold Gross profit Income (loss) from subsidiary Operating expenses Net Income Consolidated NI attrib to NCI Consolidated NI attrib to...
-
Ace Companys income statements for the three years 2012, 2011, and 2010 are given below (all amounts in $ millions): 1. Other income (expense) comprised the following: 2. In 2012, cost of goods sold...
-
Does the function f(x) = (0.68)* represent exponential growth, decay, or neither? Impossible to determine with the information given Exponential growth Neither Exponential decay
-
What is OT&E?
-
When is OT&E performed during the System Development Phase?
-
What are the six primary system development process models?
-
Why should you conduct technical reviews?
-
What is the System Developers role in OT&E?
-
Varto Company has 7,000 units of its product in inventory that it produced last year at a cost of $154,000. This year's model is better than last year's, and the 7,000 units cannot be sold at last...
-
Consider the reaction of acetic acid in water CH 3 CO 2 H(aq) + H 2 O(l) CH3CO 22 (aq) + H 3 O + (aq) where Ka 5 1.8 3 1025. a. Which two bases are competing for the proton? b. Which is the stronger...
-
Joe Vida owns the Peace Barber simple . He employs five barbers and pays each a base rate of $1,200 per month. One of the barbers serves as the manage) and receives an extra $600 per month. In...
-
Suppose you are considering an investment that grew by 32 percent across a five-year holding period. If you wanted to state this rate of return as an effective annual rate (that is, with annual...
-
Tyson Company bottles and distributes NO-KAL, a diet soft drink. The beverage is sold for 40 cents per 16-ounce bottle to retailers, who charge customers Instructions (a) Prepare a CVP income...
![Mobile App Logo](https://dsd5zvtm8ll6.cloudfront.net/includes/images/mobile/finalLogo.png)
Study smarter with the SolutionInn App